The mention of technical analysis in the halls of academia can cause serious angst. The disdain for technical analysis likely stems from a firm belief that markets can’t possibly be weak-form inefficient. The other reason researchers find technical analysis hard to swallow is the skepticism related to data-mining and the meta-analysis studies, which suggest that a majority of technical trading rules are simply bunk. Fair enough. And yet, cross-sectional momentum strategies, or strategies that sort securities on relative momentum at a given point in time, are widely published in top-tier academic journals. Why momentum is considered a valid topic to discuss, while other well known technical trading rules such as simple trend-following rules are considered heresy, is a bit odd. We decided it was time to torture the simple moving average trading rule and determine if it is simply a waste of time or something we should consider in our investment programs.
A PDF version of this is available here.
The setup for our study
The inspiration for this study stemmed from a curiosity we had after reading the following paper on Inter-Temporal Risk Parity:
Inter-temporal risk parity is a strategy which rebalances between a risky asset and cash in order to target a constant level of risk over time. When applied to equities and compared to a buy and hold strategy it is known to improve the Sharpe ratio and reduce drawdowns. We used Monte Carlo simulations based on a number of time series parametric models from the GARCH family in order to analyze the relative importance of a number of effects in explaining those benefits. We found that volatility clustering with constant returns and the fat tails are the two effects with the largest explanatory power. The results are even stronger if there is a negative relationship between return and volatility. On the other hand, if the Sharpe ratio remains constant over time, the only benefit would arise from an inter-temporal risk diversification effect which is small and has a negligible contribution. Using historical data, we also simulated what would have been the performance of the strategy when applied to equities, corporate bonds, government bonds and commodities. We found that the benefits of the strategy are more important for equities and high yield corporate bonds, which show the strongest volatility clustering and fat tails. For government bonds and investment grade bonds, which show little volatility clustering, the benefits of the strategy have been less important.
The results from the paper are promising, but we always re-backtest studies because the devil is in the details. In this situation, the paper also inspired a framework for testing the moving average rule in the context of simulations. Strategy 1: Buy and hold of S&P500. Strategy 2: When the 20-day moving average is above the 252-day moving average, risk-on; otherwise, risk-off. We tested the strategies in four different simulation environments:
- A normal distribution
- GARCH
- GARCH with T-student noise
- Historical data bootstrapping
Data in simulation: 01-01-1990 to 12-31-2013, daily value-weight market total return and 3-month US Dollar LIBOR from Bloomberg. Data in bootstrapping: 01-01-1929 to 12-31-2013, daily value-weight market excess return from French website; t-bill from French website.
How does the simulation work?
We use stochastic models to simulate the daily excess return of S&P500. These models make various assumptions about the nature of daily stock returns (we will explain the details below for each model). The following paper has more background on each model. The empirically observed annualized volatility of the S&P500 daily return during that period of time is 18.5%; the annualized returns of S&P500 in excess of risk-free in that same period is 7.5%. For modeling purposes, we simulate the S&P500 excess return from a Normal Distribution N (7.5%, 18.5%), which is our base simulation model. The GARCH model and the GARCH T-student noise model are introduced as well. These models are meant to capture the empirical observation that monthly stock returns aren’t normally distributed. GARCH attempts to capture volatility clustering and GARCH T captures GARCH effects plus a fat tail effect. These 2 effects better reflect empirical observations on monthly stock returns. We simulated 500 Monte-Carlo scenarios in each of the models. After the simulation, we also look at an “empirical bootstrap” model, which draws data from the actual distribution of historical stock returns. We randomly select 1200 days of consecutive daily data for each simulation run (500 simulations).
Normal Distribution
In a normally distributed world, moving average rules are roughly equal to buy and hold–no obvious edge. The chart below highlights something the summary statistics do not truly capture: MA kills the upside!
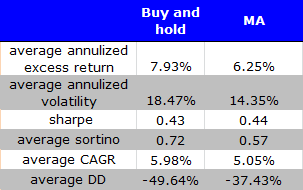
The results are hypothetical results and are NOT an indicator of future results and do NOT represent returns that any investor actually attained. Indexes are unmanaged, do not reflect management or trading fees, and one cannot invest directly in an index. Additional information regarding the construction of these results is available upon request.
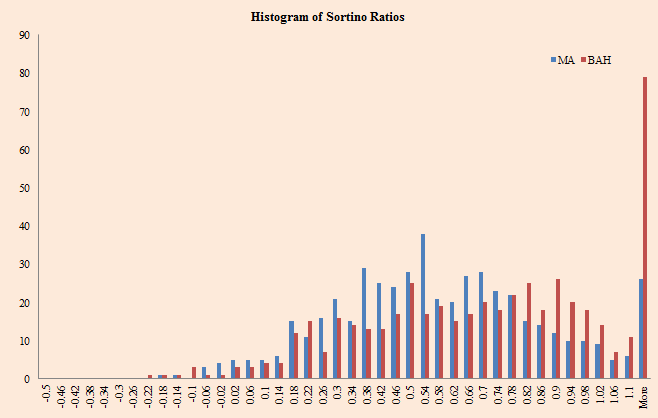
The results are hypothetical results and are NOT an indicator of future results and do NOT represent returns that any investor actually attained. Indexes are unmanaged, do not reflect management or trading fees, and one cannot invest directly in an index. Additional information regarding the construction of these results is available upon request.
 GARCH
GARCH
In a world with clustered volatility, moving average rules still underwhelm the tactical investor.
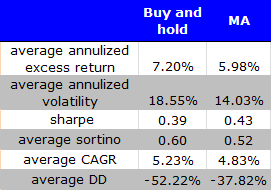
The results are hypothetical results and are NOT an indicator of future results and do NOT represent returns that any investor actually attained. Indexes are unmanaged, do not reflect management or trading fees, and one cannot invest directly in an index. Additional information regarding the construction of these results is available upon request.
The chart below highlights a similar finding from above: MA kills the upside.
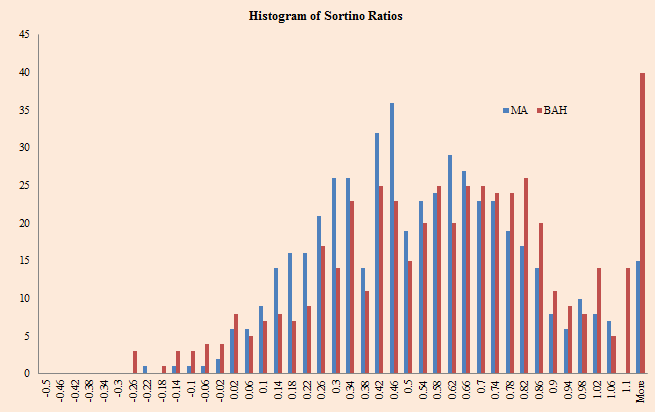
The results are hypothetical results and are NOT an indicator of future results and do NOT represent returns that any investor actually attained. Indexes are unmanaged, do not reflect management or trading fees, and one cannot invest directly in an index. Additional information regarding the construction of these results is available upon request.
GARCH with student T distribution
What about fat-tails? Even with fat tails, moving averages rules don’t add value, at the margin.
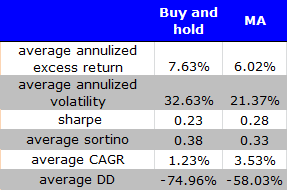
The results are hypothetical results and are NOT an indicator of future results and do NOT represent returns that any investor actually attained. Indexes are unmanaged, do not reflect management or trading fees, and one cannot invest directly in an index. Additional information regarding the construction of these results is available upon request.
Nothing striking from the histogram.
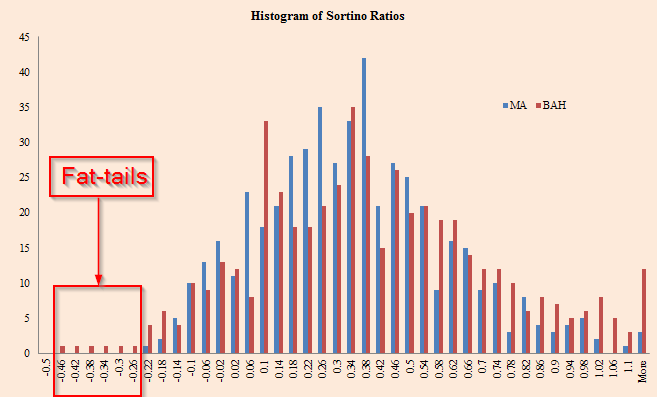
The results are hypothetical results and are NOT an indicator of future results and do NOT represent returns that any investor actually attained. Indexes are unmanaged, do not reflect management or trading fees, and one cannot invest directly in an index. Additional information regarding the construction of these results is available upon request.
Live Data Bootstrapping
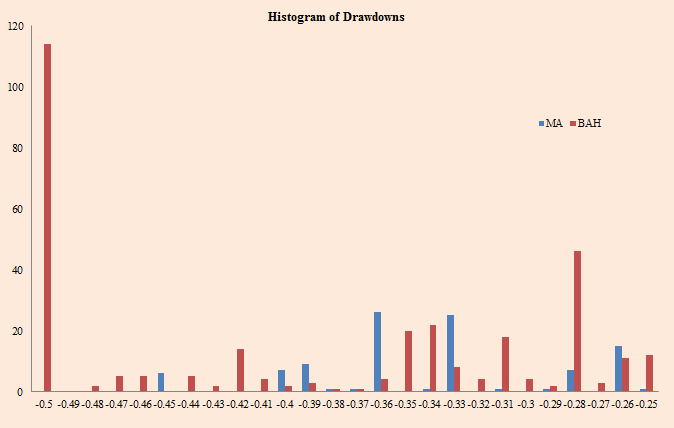
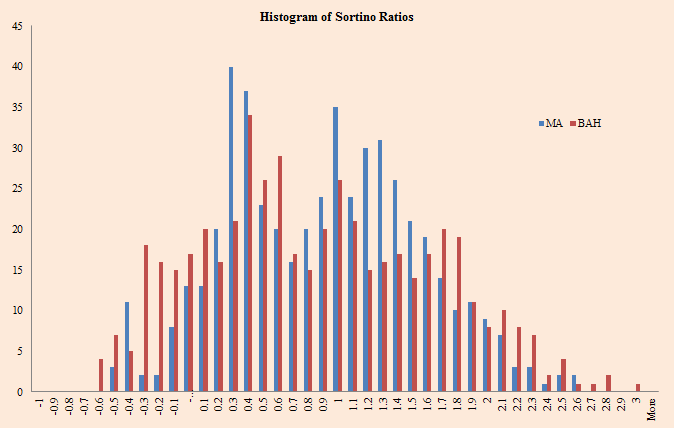
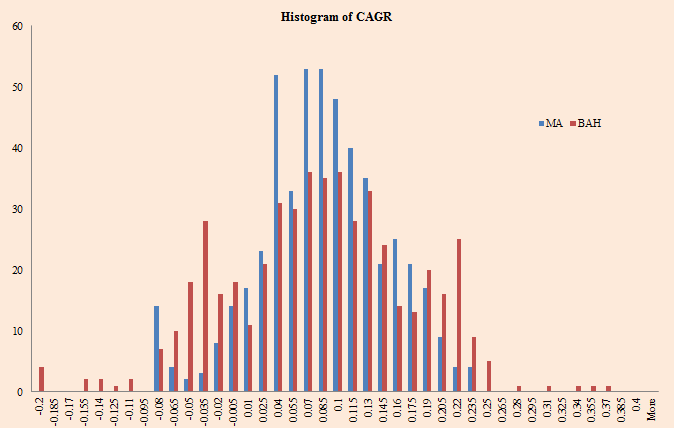
The 3 simulations above involve a computer generating “fake” stock returns that have characteristics we think reflect reality (normal distribution, fat tails, clustered, vol, etc). Of course, another simulation approach involves simulating from the actual distribution of stock prices. Using the actual distribution of returns we find that moving average rules are significantly better than buy and hold.
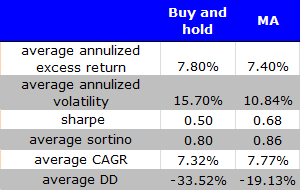
The results are hypothetical results and are NOT an indicator of future results and do NOT represent returns that any investor actually attained. Indexes are unmanaged, do not reflect management or trading fees, and one cannot invest directly in an index. Additional information regarding the construction of these results is available upon request.
Sharpe Ratios:
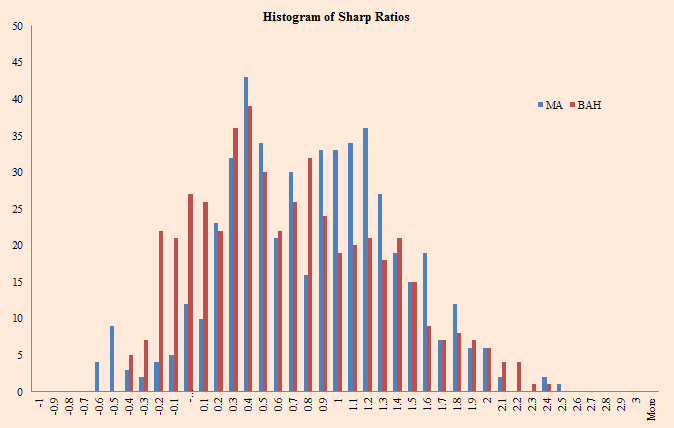
The results are hypothetical results and are NOT an indicator of future results and do NOT represent returns that any investor actually attained. Indexes are unmanaged, do not reflect management or trading fees, and one cannot invest directly in an index. Additional information regarding the construction of these results is available upon request.
Drawdowns:
The results are hypothetical results and are NOT an indicator of future results and do NOT represent returns that any investor actually attained. Indexes are unmanaged, do not reflect management or trading fees, and one cannot invest directly in an index. Additional information regarding the construction of these results is available upon request.
Sortino ratios:
The results are hypothetical results and are NOT an indicator of future results and do NOT represent returns that any investor actually attained. Indexes are unmanaged, do not reflect management or trading fees, and one cannot invest directly in an index. Additional information regarding the construction of these results is available upon request.
CAGR ratios:
The results are hypothetical results and are NOT an indicator of future results and do NOT represent returns that any investor actually attained. Indexes are unmanaged, do not reflect management or trading fees, and one cannot invest directly in an index. Additional information regarding the construction of these results is available upon request.
Why are Bootstrap results so different from modeled results?
One argument is data-mining. This is always a viable alternative hypothesis. Another argument is that simulating stock prices from a model based on certain parameters can never truly capture the distribution of actual stock returns. The results from bootstrapping seem to suggest that moving average trading rules represent a promising technical trading rule in the “real world,” despite the fact there are legions of researchers suggesting technical analysis is bunk.
About the Author: Wesley Gray, PhD
—
Important Disclosures
For informational and educational purposes only and should not be construed as specific investment, accounting, legal, or tax advice. Certain information is deemed to be reliable, but its accuracy and completeness cannot be guaranteed. Third party information may become outdated or otherwise superseded without notice. Neither the Securities and Exchange Commission (SEC) nor any other federal or state agency has approved, determined the accuracy, or confirmed the adequacy of this article.
The views and opinions expressed herein are those of the author and do not necessarily reflect the views of Alpha Architect, its affiliates or its employees. Our full disclosures are available here. Definitions of common statistics used in our analysis are available here (towards the bottom).
Join thousands of other readers and subscribe to our blog.

