New Evidence on the Relation Between the Enterprise Multiple and Average Stock Returns
- Loughran and Wellman
- A version of the paper can be found here. (Also described in a much more entertaining fashion in Toby’s new book: Deep Value)
- Want a summary of academic papers with alpha? Check out our Academic Research Recap Category.
Abstract:
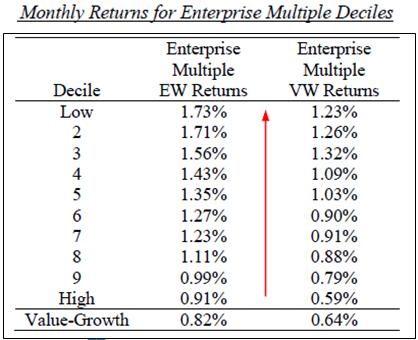
Practitioners increasingly use the enterprise multiple as a valuation measure. The enterprise multiple is (equity value debt preferred stock – cash)/ (EBITDA). We document that the enterprise multiple is a strong determinant of stock returns. Following Fama and French (1993) and Chen, Novy-Marx, and Zhang (2010), we create an enterprise multiple factor that generates a return premium of 5.28% per year. We interpret the enterprise multiple as a proxy for the discount rate. Firms with low enterprise multiple values appear to have higher discount rates and higher subsequent stock returns than firms with high enterprise multiple values.
Core Idea:
Tests the effectiveness of enterprise multiples.
- Enterprise value = market value of equity + debt + preferred stock – cash and short-term investments
- Enterprise Multiple (EM) = EV/EBITDA
Alpha Highlight:
- Using Enterprise Multiples as a screening tool works, as those with low EM outperform those with high EM.
The results are hypothetical results and are NOT an indicator of future results and do NOT represent returns that any investor actually attained. Indexes are unmanaged, do not reflect management or trading fees, and one cannot invest directly in an index. Additional information regarding the construction of these results is available upon request.
Their explanation for why it works: “What drives the enterprise multiple effect in stock returns? We interpret the enterprise multiple as a proxy for the unlevered investment return (i.e., the weighted average cost of capital), which is in turn positively related to the firm’s cost of equity. Firms with high enterprise multiple values (signaling high valuation ratios) appear to have lower discount rates and lower subsequent realized stock returns than firms with low EM values.”
Our research yields similar results.

About the Author: Wesley Gray, PhD
—
Important Disclosures
For informational and educational purposes only and should not be construed as specific investment, accounting, legal, or tax advice. Certain information is deemed to be reliable, but its accuracy and completeness cannot be guaranteed. Third party information may become outdated or otherwise superseded without notice. Neither the Securities and Exchange Commission (SEC) nor any other federal or state agency has approved, determined the accuracy, or confirmed the adequacy of this article.
The views and opinions expressed herein are those of the author and do not necessarily reflect the views of Alpha Architect, its affiliates or its employees. Our full disclosures are available here. Definitions of common statistics used in our analysis are available here (towards the bottom).
Join thousands of other readers and subscribe to our blog.