The worst thing I can be is the same as everybody else.
—Attributed to Arnold Schwarzenegger
The debate over passive versus active investing is akin to other classic conflicts, such as Eagles vs. Cowboys or Coke vs. Pepsi. In short, once our preference for one style over the other is established, it becomes a proven fact or incontrovertible reality in our minds.
This post is not meant to convert a passive investor into an active investor; however, we do explain why we believe some active investing approaches can logically beat passive strategies over a reasonably long time horizon (clearly nothing works forever).(1) Our framework also helps investors decipher the quantitative “factor zoo,” to determine if data-mining computers have actually identified a sustainable active strategy or a pipe dream.
We cannot overemphasize that identifying sustainable alpha in the market is no cakewalk. More importantly, being smart, having superior stock-picking skills, or amassing an army of PhDs to crunch data is only half of the equation. Even with those tools, you are still only one shark in a tank filled with other sharks. All sharks are smart, all sharks have a MBA or PhD from a fancy school, and all the sharks know how to analyze a company. Maintaining an edge in these shark infested waters is no small feat, and one that only a handful of investors has accomplished.
Perhaps all the edge in investing is gone. There are too many CFAs. There are too many computers. There are too many quant PhDs. Is active investing dead? Many authors, such as Charlie Ellis, have suggested that active investing is a “Loser’s game,” in the sense that there are too many smart people chasing too few ideas. The hypothesis Ellis emphasizes leverages recent decreases in classic factor premiums, such as value and momentum, as evidence that the loser’s game is well underway. For example, here is a chart on the performance of momentum over the past several decades:(2)
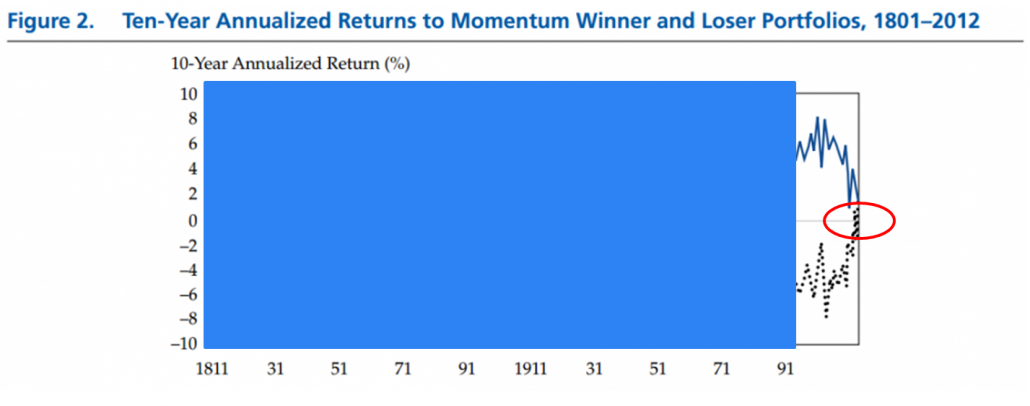
Certainly seems like the Ellis story aligns with the recent data. But correlation is not causation. Here is a chart extended back to 1801 which shows that decade long periods of poor relative performance are not uncommon.
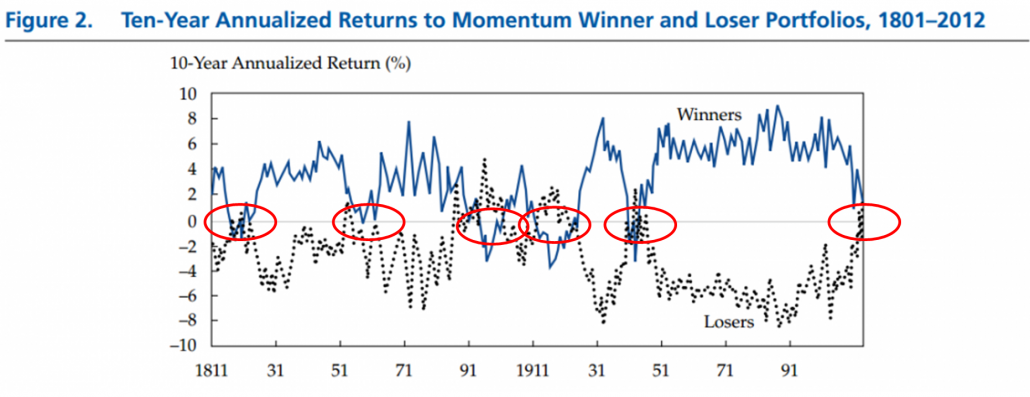
If we go down the path that better technology, smarter people, and more competition are associated with arbitraging away factor premiums, we also need to then explain why momentum went on a 10-year drought around the Civil War. Were the soldiers trading their rifles in for some modern portfolio theory lessons (even though it didn’t exist)? Why did value get its face-ripped in the early 60’s? Maybe the publication of Fama’s dissertation thesis sparked a herd of quants to open funds (even though there weren’t any quant funds)?
But there is a paradox. If investors are getting smarter and faster, how can edge continue? And how can open secrets work? Mispricing should be eliminated on the spot — correct? A deeper look into the question suggests that being smarter and being faster doesn’t always make prices more efficient. There’s a lot more to the story.
So what is the story? We still aren’t sure, and we are always learning. Our best working theory is that there are two components that drive sustainable success for active investors:
- A keen understanding of human psychology, and
- A thorough grasp of “smart money” incentives.
We start our intellectual journey where mine began: as an aspiring PhD student studying at the University of Chicago. Let the adventure begin…
Note: Are you a visual learner? Here is a video presentation on the same topic:
A PDF version of this is available here.
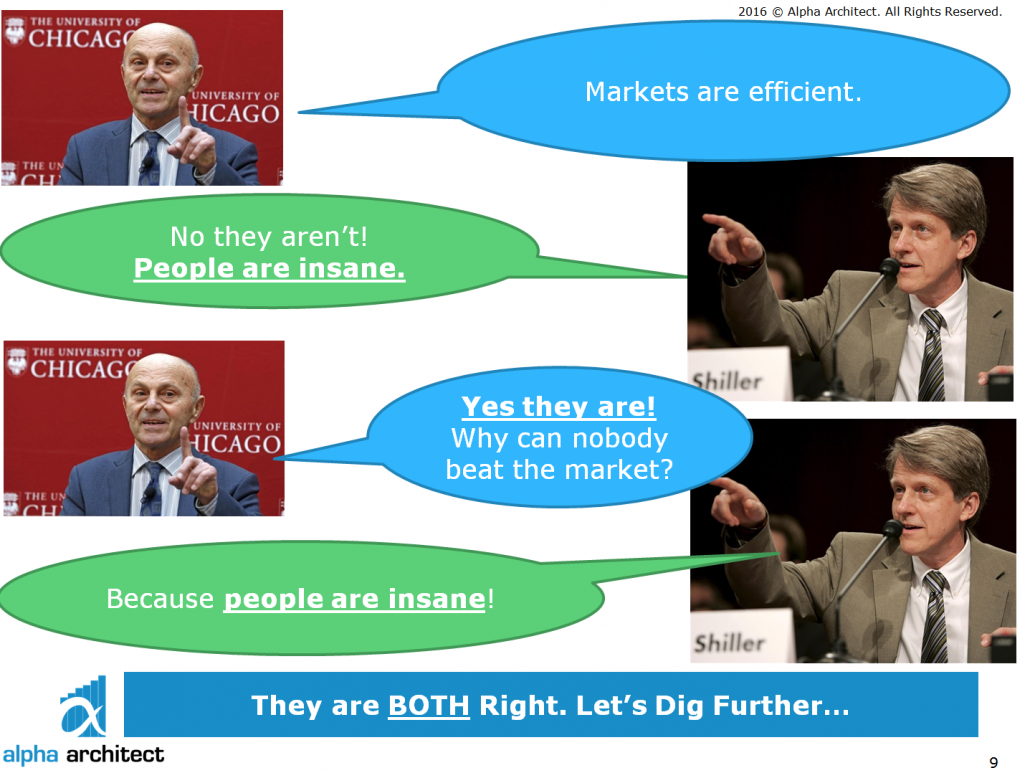
Into the Lion’s Den: Pitching Market Inefficiency in the Land of Efficient Markets
I entered the University of Chicago Finance PhD program 13 years ago (Fall 2002). It was the beginning of a painful, but highly enlightening journey into the world of advanced finance. For context, the UChicago finance department maintains a rich legacy associated with having established, and successfully defended, the Efficient Market Hypothesis (EMH). PhD students in the department spend their first 2 years in grueling, graduate-level finance courses infused with highly technical mathematics and statistics. The final 2-4 years are dedicated to dissertation research. I would describe these conditions as: “sweatshop factory meets international mathematics competition.” The program was tough.
After surviving my first 2 years of intellectual waterboarding, I needed a break. I took a unique “sabbatical”, and decided to join the United States Marine Corps for 4 years. Long story short: I wanted to serve and I wasn’t getting any younger.
I returned to the PhD program in 2008 to finish my dissertation. My time in the Marines taught me a lot of things, but one lesson stood out from the rest: “Make Bold Moves.” And of course, what is the boldest move one can do at the University of Chicago?
Focus on research that questions the efficient market hypothesis.
OK…sounds bold…how the heck are we going to show this?
Inefficient Market Mavericks: Value Investors
I wanted to determine if traditional value-investors can “beat the market.” I had been following a value investing strategy with my own account for over 10 years. I was a tried-and-true believer in the Ben Graham mantra: margin of safety. The story that long-term value investing beats the market was compelling, but much of the rhetoric in academic circles, and the research published in top-tier academic journals, suggested otherwise.
The “value” debate was reinvigorated by the famous Fama and French 1992 paper, “The Cross-Section of Expected Stock Returns.” The paper sparked a debate over whether or not the so-called value premium, or the large spread in historical returns between cheap stocks and expensive stocks, was due to extra risk or to mispricing. Were the excess returns of value stocks a reward for added economic risk factors borne by shareholders, or were these stocks simply mispriced? For Eugene Fama and Ken French, the answer was clear: The value premium must be attributed to higher risk if the market was efficient. The risk-based argument for the value premium seemed far-fetched to me, as I was a Ben Graham aficionado. Graham and his disciple Warren Buffett were famous for beating the market over long periods of time by buying cheap stocks. Their claim was that “Mr. Market,” who represented the broad market, was characterized as a manic-depressive person with deep psychological problems: Mr. Market would sometimes offer stocks for prices below their fundamental value (e.g., the trough of the 2008 financial crisis) or above their fundamental value (e.g., during the Internet bubble of the late 1990s). And if a value investor purchased cheap, eventually Mr. Market would agree. But could it be the case that the stocks these value investors bought had high returns, not because they outsmarted Mr. Market, but because they were buying more risk and got lucky? I began digging.
I started collecting data on nearly 4,000 stock picks submitted by top fund experts, asset managers, and value enthusiasts to Joel Greenblatt’s website, ValueInvestorsClub.com. And this wasn’t just any club. Highly selective, screened for quality, and regarded as one of the best sites on the web for market ideas, these members were true heavy hitters in the value investing arena.(3)
After a year of toil and anguish, I compiled several thousand stock recommendations into a database so I could conduct a thorough analysis. The results were extremely compelling–there was strong evidence that these “Varsity Value Investors” exhibited significant stock picking skills.
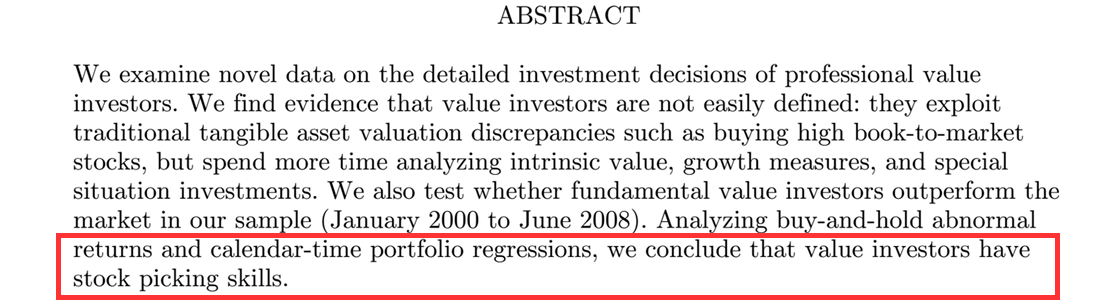
Excited to share my new findings, I eagerly drafted a paper, which included the following abstract:
Figure 1a: “Value investors have stock picking skills.”
I immediately sent my draft dissertation to my advisor, who happened to be the godfather of the Efficient Market Hypothesis. Eugene Fama, a strong–if not the strongest–supporter of EMH reviewed my results. The response I received was less than ideal:
Figure 1b: “Your conclusion has to be false.”
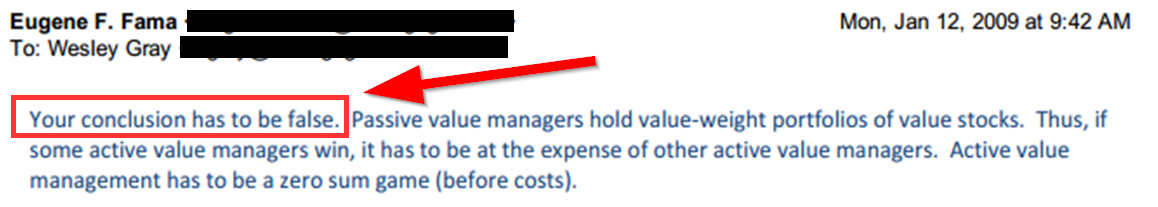
I sped down to Dr. Fama’s office to get some clarification. The last thing I wanted was a year’s worth of blood, sweat, and tears to get tossed out the window. My evidence seemed solid. Was Dr. Fama simply being dogmatic? I had to know exactly why Dr. Fama disagreed. Sweating profusely, with the prospect of the PhD degree slowly slipping away, I asked one of the world’s most famous financial economists for clarification.
Fama responded:
“Listen, the data and analysis are sound, you simply can’t say that, “value investors have stock picking skills,” but instead you need to qualify that statement with, “the sample of value investors we investigated,” have stock picking skills.”
I sat back, relieved. Sounds like I might graduate after all. Prof. Fama was correct: My findings did not suggest that all value investors have skill, merely the sample I was investigating had skill. Crisis averted. I graduated the following year, with my research affirming, at least for me, if not for Dr. Fama, that markets were not perfectly efficient and value investors might have an edge. Soon thereafter, I took a job as a finance professor at Drexel University and met Jack Vogel, who was a finance PhD student at the time. Jack would go on to publish his dissertation, which suggested the extra returns associated with value stocks were likely driven by mispricing and not additional risk.
But nagging questions abounded: What gives a certain investor “edge”? What characteristics drive alpha? Why can one active investor (the winner) systematically take money from other investors (the losers)?
Enter Behavioral Finance
As I plowed through thousands of stock-picking proposals, one key takeaway was present. These analysts were good. Collectively, they had skill. They were smart. They all made compelling cases that statistically outperformed in the aggregate. But Jack’s dissertation research also found that harnessing the power of a computer to buying generically cheap stocks with strong fundamentals performed about equally well as the fundamental stock pickers that Wes had investigated in his dissertation. Value investing, whether driven by a human or a computer, beat the market. But why?
Enter behavioral finance. As mentioned in the introduction, many in the market are smart and capable—intellect alone cannot be the driver of superior returns. What enabled the value investors I studied to buy low and sell high, and why was the efficient market hypothesis not stopping them?
John Maynard Keynes, a shrewd observer of financial markets and a successful investor in his own right, highlights the paradox that behavioral finance represents. At one point, Keynes was nearly wiped out while speculating on leveraged currencies (despite being a highly successful investor). This downfall led him to share one of the greatest investing mantras of all time:(4)
“Markets can remain irrational longer than you can remain solvent.”
Keynes’ quip highlights two key elements of real world markets that the efficient market hypothesis doesn’t consider: investors can be irrational and arbitrage is risky. The concept that “arbitrage is risky” is related to what academics call “limits to arbitrage,” or market frictions. In academic parlance, “investors can be irrational” boils down to an understanding of psychology. These two elements–limits to arbitrage and psychology–are the building blocks for behavioral finance (depicted in Figure 2, below).
Figure 2: The 2 Pillars of Behavioral Finance
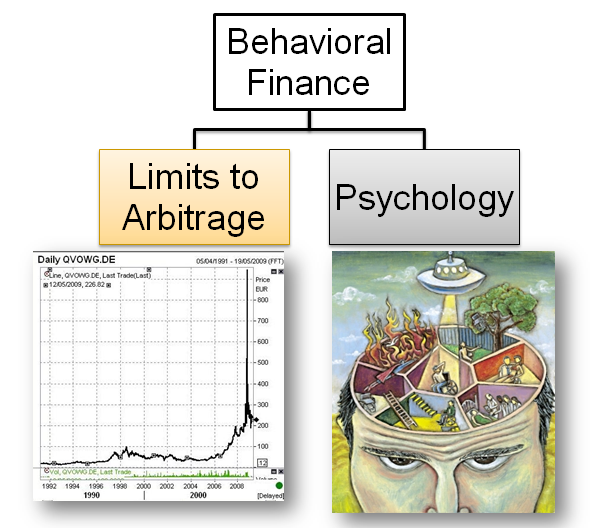
Limits of Arbitrage
First, let’s discuss limits to arbitrage, more commonly referred to as market frictions. The efficient market hypothesis predicts that prices reflect fundamental value. Why? People are greedy and any mispricings are immediately corrected by those smart, savvy investors that can make a quick profit. But in today’s world of instant information, supercomputers, and interconnected markets, true arbitrage–profits earned with zero risk after all possible costs–rarely, if ever, exists. Most arbitrage involves some form of cost or risk (risk of buying at the wrong price, risk of paying high transaction costs, liquidity, etc). Let’s look at a simple example:
Arbitraging oranges:
- Oranges in Florida cost $1 each.
- Oranges in California cost $2 each.
- The fundamental value of an orange is $1 (Assumption for the example).
- The EMH suggests arbitrageurs will buy in Florida and sell in California until California oranges cost $1.
But what if it costs $1 to ship oranges from Florida to California? Prices are decidedly not correct–the fundamental value of an orange is $1. But there is no free lunch since the frictional costs are a limit to arbitrage. In short, the smart, savvy arbitrageurs are prevented from exploiting the opportunity (in this case, due to frictional shipping costs).
Investor Psychology
News flash: humans beings are not rational 100% of the time. To anyone who has been married, driven without wearing a seat belt, or hit the snooze button on their alarm clock, this should be pretty clear. And the literature from top psychologists is overwhelming for remaining naysayers. Daniel Kahneman, the Nobel-prize winning psychologist, and author of New York Times Bestseller Thinking, Fast and Slow, tells a story of 2 modes of thinking: System 1 and System 2. System 1 is the “think fast, survive in the jungle” portion of the human brain. When we start to run away from a poisonous snake (even if later on, it turns out to be a stick), you are relying on our trusty System 1. System 2 is the analytic and calculating portion of the brain that is slower, but 100% rational. When you are comparing the costs and benefits of refinancing your mortgage, you are likely using System 2.
System 1 keeps us alive in the jungle. System 2 helps us make rational decisions for long-term benefit. Both serve their purpose; however, sometimes one system can muscle onto the turf of the other. When System 1 starts making System 2 decisions, we can get in a lot of trouble. Do any of these sound familiar?
- “That diamond bracelet was so beautiful, I just had to buy it.”
- “Dessert comes free with dinner, of course I had to have some.”
- “Home prices never seem to go down. We gotta buy!”
Unfortunately, the efficiency of System 1 comes with drawbacks–what keeps us alive in the jungle isn’t necessarily what saves us from ourselves in the markets.
Now, let’s combine our irrational investors (System 1 types) with the limits of arbitrage that we discussed above (smart people that simply can’t take advantage of the System 1 types for some reason). Combining bad investor behaviors with the frictions that smart people run into, could create compelling investment opportunities for uniquely situated investors.
For example, consider the concept of “noise traders:” think day traders that ignore fundamentals and trade on “gut”—classic System 1 types. These irrational noise traders can dislocate prices from fundamentals, but because these traders are irrational, arbitrageurs have a hard time pinning down the timing and duration of these irrational trades. Thus, going back to the idea that markets can remain irrational longer than you can remain solvent, an element of risk arises when an arbitrageur tries to exploit a noise trader. Sure, noise traders are irrational now, but perhaps they will be even more irrational tomorrow? Brad De Long, Andrei Shleifer, Larry Summers, and Robert Waldmann described this phenomenon in “Noise Trader Risk in Financial Markets,” in the Journal of Political Economy in 1990.
Here is an abridged abstract from the paper:
The unpredictability of noise traders’ beliefs creates a risk in the price of the asset that deters rational arbitragers from aggressively betting against them. As a result, prices can diverge significantly from fundamental values even in the absence of fundamental risk.
Let’s translate this into English:
Day traders mess up prices, and although these people are idiots, you don’t know the extent of their idiocy, and you can’t really time the strategy of an idiot anyway, so most smart people don’t even try to take advantage of them. Consequently, prices move around a lot more than they should because no one is stopping the idiots. It’s too risky! Moreover, since prices move around a lot more, the returns can be higher, so some lucky idiots may think they are actually good at timing markets, which incentivizes more idiots to do more idiotic things.
This combination of bad behavior and market frictions describes what behavioral finance is all about:
Behavioral Bias + Market Frictions = Mispriced Assets
And while this working definition of behavioral finance may seem simple, the debate surrounding behavioral finance is far from settled. In one corner, the efficient market clergy claims that behavioral finance is heresy, reserved for those economists who have lost their way and diverted from the “truth.” In their view, prices always reflect fundamental value. Some in the efficient market camp point to the evidence that active managers can’t beat the market in the aggregate and incorrectly conclude that prices are always efficient as a result. In the other corner, practitioners that leverage “behavioral bias” suggest that they have an edge because they exploit investors with behavioral bias. Yet, practitioners who make these claims often have terrible performance.
So what is the disconnect?
The disconnect lies in the fact that both sides of the argument fail to assess both the bad behaviors of the market AND the limits to arbitrage. Passive investors assume there are no limits to arbitrage and markets are perfectly efficient. Practitioners who claim to exploit behavioral bias believe they are the smartest poker players at the table, but they ignore the fact there are other smart poker players who have also identified behavioral bias in the marketplace.
Good Investing is like Good Poker: Pick the Right Table
Behavioral finance hints at a framework for being a successful active investor:
- Identify market situations where behavioral bias is driving prices from fundamentals (e.g., identify market opportunity).
- Identify the actions/incentives of the smartest market participants and understand their arbitrage costs.
- Find situations where mispricing is high and arbitrage costs are high for the majority of arbitrage capital, but the costs are low for an active investor with low arbitrage costs.
One can think of the situation outlined above as analogous to a poker player seeking to find a winnable poker game. And in the context of poker, picking the right table is critical for success:
- Know the fish at the table (opportunity is high).
- Know the sharks at the table (opportunity is low).
- Find a table with a lot of fish and few sharks.
Following the poker analogy, in Figure 3, the graphic outlines the questions we must ask as an active investor in the marketplace:
- Who is the worst player at the table?
- Who is the best player at the table?
Figure 3: Identifying Opportunity in the Market
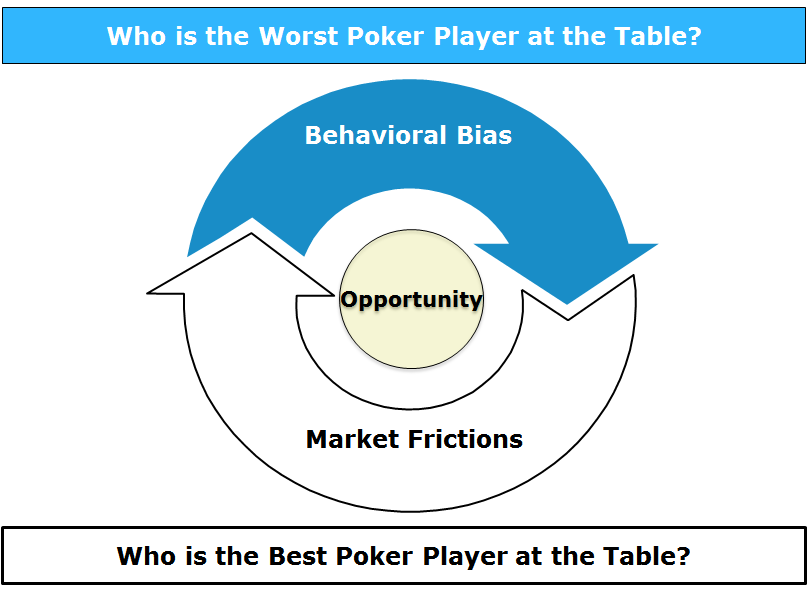
To be successful over the long haul, an active investor needs to be good at identifying market opportunities created by poor investors, but also skilled at identifying situations where savvy market participants are unable or unwilling to act because their arbitrage costs are too high.
Understanding the Worst Poker Players
While stationed in Iraq, I saw stunning displays of poor decision-making. Obviously, in areas where violence could break out at any moment, it was of paramount importance to stay focused on standard operating procedures. But in extreme conditions where temperatures regularly reached over 125 degrees, stressed and sleep-deprived humans can sometimes do irrational things.
In Figure 4, I am situated at a combat checkpoint in Haditha, a village in Al Anbar Province. I am explaining to my Iraqi counterparts how to set up a tactical checkpoint. A quick inspection of the photograph highlights how a stressful environment can make some people do irrational things. My Iraqi friend directly beside me in the photo is wearing a Kevlar helmet, carrying extra ammunition, and has a water source on his gear. These are all rational decisions:
- Kevlar helmets are important because mortar rounds can kill you.
- Rational reaction: wear your Kevlar helmet!
- Ammunition is important because shooting back can save you.
- Rational reaction: carry ammunition!
- Water is important because 125-degree heat can kill you.
- Rational reaction: carry water!
While all of these things sound rational, the Iraqi on the far right isn’t wearing a Kevlar, isn’t carrying extra ammo, and doesn’t have a source of water.
Figure 4: Chaotic Environments + Emotion + Stress = Bad-Decision Making

Is my irrational Iraqi friend abnormal? Not really. All human beings suffer from behavioral bias and these biases are magnified in stressful situations. After all, we’re only human.
Below I laundry list a plethora of biases that can affect investment decisions on the “financial battlefield”:
- Overconfidence (“I’ve been right before . . .”)
- Optimism (“Markets always go up.”)
- Self-attribution bias (“I called that stock price increase . . .”)
- Endowment effect (“I have worked with this manager for 25 years, he has to be good.”)
- Anchoring (“The market was up 50 percent last year, I think it will return between 45 and 55 percent this year.”)
- Availability (“You see the terrible results last quarter? This stock is a total dog!”)
- Framing (“Do you prefer a bond that has a 99 percent chance of paying its promised yield or one with a 1 percent chance of default?”—hint, it’s the same bond.)
Psychology research is clear: humans are flawed decision-makers, especially under duress.
But even if we identify poor investor behavior, that identification does not necessarily imply that an exploitable market opportunity exists. As discussed previously, other smarter investors will surely be privy to the mispricing situation before we are aware of the opportunity. They will attempt immediately to exploit the opportunity, eliminating our ability to profitably take advantage of mispricing caused by biased market participants. We want to avoid competition, but to avoid competition we need to understand the competition.
Understanding the Best Poker Players
In the context of financial markets, the best pokers players are often those investors managing the largest amounts of money. They are the hedge funds with all-star managers or institutional titans running massive fund complexes. The resources available to these investors are remarkable and vast. One can rarely overpower this sort of opponent. Thankfully, overpowering isn’t the only way to slay Goliath. One can outmaneuver these titans because many top players are hamstrung by economic incentives.
Before we dive into the incentives of these pokers players, let’s quickly review the concept of arbitrage. The textbook definition of “arbitrage” involves a costless investment that generates riskless profits, by taking advantage of mispricings across different instruments representing the same security. In practice, arbitrage entails costs as well as the assumption of risk, and for these reasons, there are limits to the effectiveness of arbitrage. There is ample evidence for such limits to arbitrage. Examples include the following:
- Fundamental Risk. Arbitragers may identify a mispricing of a security that does not have a perfect substitute that enables riskless arbitrage. If a piece of bad news affects the substitute security involved in hedging, the arbitrager may be subject to unanticipated losses. An example would be Ford and GM—similar stocks, but they are not the same company.
- Noise Trader Risk. Once a position is taken, noise traders may drive prices farther from fundamental value, and the arbitrageur may be forced to invest additional capital, which may not be available, forcing an early liquidation of the position.
- Implementation Costs. Short selling is often used in the arbitrage process, although it can be expensive because of the “short rebate,” which represents the costs to borrow the stock to be sold short. In some cases, such borrowing costs may exceed potential profits. For example, if short rebate fees are 10 percent and the expected arbitrage profits are 9 percent, there is no way to profit from the mispricing.
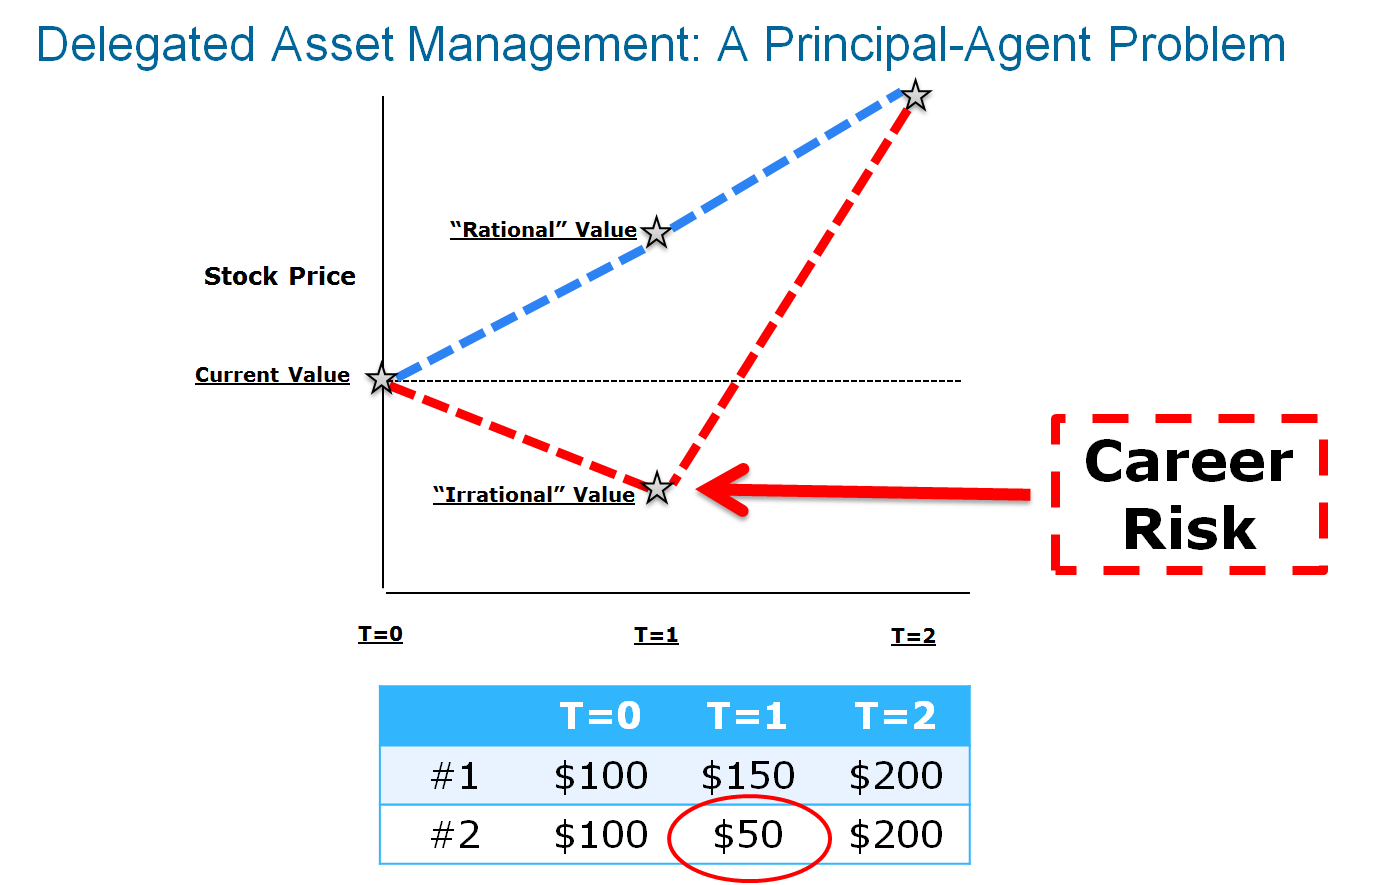
The three market frictions mentioned are important. There are potentially many others, but the biggest risk for most smart players is the balance they must strike between long-term expected performance and career risk. An explanation is in order. The biggest short-circuit to the arbitrage process are the limits imposed on smart fund managers that face short-term focused performance assessments. Consider the pressures produced by tracking error, or the tendency of returns to deviate from a standard benchmark. Say a professional investor has a job investing the pensions of 100,000 firemen. They have a choice of investment strategies.
The professional investor can invest in the following options:
- Strategy A:A strategy that they know (by some magical means) will beat the market by 1 percent per year over 25 years. But, they also know that this strategy will never underperform the index by more than 1 percent in a given year; or
- Strategy B: An arbitrage strategy that the investor knows (again, by some magical means) will outperform the market, on average, by 5 percent per year over the next 25 years. The catch is that the investor also knows that they will have a 5-year period where they underperform by 5 percent per year.
Which strategy does the investment professional choose? If they are being hired on behalf of 100,000 firemen, the choice is often obvious, despite being sub-optimal for their investors: choose Strategy A and avoid getting fired!
Why choose A? This strategy is bad long-term strategy relative to B. The incentives of an investment manager are complex. Fund managers are not the owners of the capital, but work on behalf of someone who does. Financial mercenaries, if you will. These managers sometimes make decisions that increase the odds of them keeping their job, but will not necessarily maximize risk-adjusted returns for their investors. For these managers, relative performance is everything and tracking error is dangerous. In the example above, the tracking error on Strategy B is just too painful to digest. Those firemen are going to start screaming bloody murder during the five years of underperformance, and the manager will not be around long enough to see the rebound when it occurs after year 5. But if the manager follows Strategy A, he can avoid career risk and the fireman’s pension will not endure the stress of a prolonged downturn.
Over long time frames, a mispricing opportunity may be a mile wide—you could drive a proverbial truck through it. But this agency problem—the fact that the owners of the capital can, in the short-term, begin to doubt the abilities of the arbitrageur and pull their capital—precludes smart managers from taking advantage of the long-term mispricing opportunities that are highly volatile.
The threat of short-term tracking-error is very real. The following quotes are from a WSJ article written on Ken Heebner’s CGM Focus Fund.
First, the WSJ facts on Ken’s fund performance:
“Ken Heebner’s $3.7 billion CGM Focus Fund, rose more than 18% annually and outpaced its closest rival by more than three percentage points.”
Next, the WSJ lays out some facts on the performance of investors in Ken’s fund:
“Too bad investors weren’t around to enjoy much of those gains. The typical CGM Focus shareholder lost 11% annually in the 10 years ending Nov. 30, according to investment research firm Morningstar Inc.”
Ken’s Heebner’s experience highlights this conflict of interest problem for asset managers. The dynamics of this problem are explored in an illuminating 1997 Journal of Finance paper by Andrei Shleifer and Robert Vishny, appropriately called “The Limits of Arbitrage.” The takeaway from Ken Heebner’s experience and Shleifer and Vishny’s insights is as follows:
Smart managers avoid long-term market opportunities if their investors are focused on short-term performance.
And can you blame the managers?

If their careers depend on their relative performance over a month, a year, or even every five years, then asset managers will clearly care more about short-term relative performance than about long-term expected risk-adjusted returns. Whether they are proactively protecting their jobs or the clients are actively driving the conversation around near-sighted metrics, the end result is the same. Fund investors lose, and prices are not always efficient.
Keys to Long-Term Active Management Success
We’ve outlined a few elements of the marketplace. First, some investors are probably making poor investment decisions, and second, some managers are unable to exploit genuine market opportunities. We encapsulate these elements in a simple equation for sustainable long-term performance in Figure 5.
Figure 5: The Long-Term Performance Equation
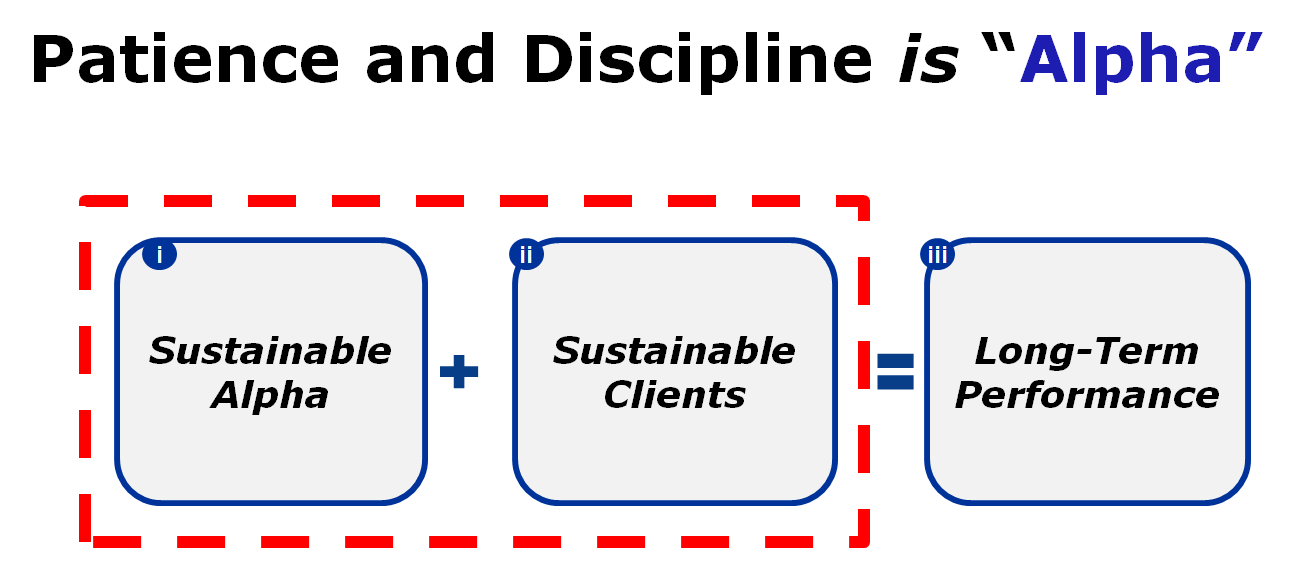
The long-term performance equation has two core elements:
- Sustainable alpha
- Sustainable investors/clients
Patience and discipline might be the only true sustainable alpha in the marketplace.
Sustainable alpha refers to an active stock selection process that systematically exploits mispricings caused by behavioral bias in the marketplace (i.e., finds the worst poker players). In order for this “edge” to be sustainable, it cannot be arbitraged away in the long run. Typically, sustainable edges are driven by strategies that require a long-horizon and indifference to short-term relative performance in order to be successful. That requirement brings us to our second element of the long-term performance equation: sustainable investors. Sustainable investors cannot fall victim to the siren song of short-term underperformance. If they do fall prey to short-termism, these unsustainable investors will greatly enhance the arbitrage costs for their delegated asset manager, and will thus prevent the investors from profitably exploiting mispricing opportunities.
Based on the equation, if one can identify a process with an established edge (i.e., sustainable alpha) that requires long-term discipline to exploit (i.e., requires sustainable investors), it is likely that this process will serve as a promising long-term strategy that will beat the market over time.
Moving from Theory to Practice
Much of the discussion above outlines an intellectual framework for successful active investing. The building blocks to create sustainable performance, framed appropriately, are simple to follow. To put a little bit of meat on the bone, we provide an example of how this construct works in practice. Our example is value investing, the practice of purchasing portfolios of firms with low prices to some fundamental price metric (e.g., P/E, P/B, or EBITDA/TEV). Figure 6 below is taken from our paper, “Analyzing Valuation Measures: A Performance Horse Race over the Past 40 Years,” published in the Journal of Portfolio Management. In the paper, we run a horse race among valuation metrics and tally the results. Row “1” is the performance of the top 20% most expensive stocks and row “5” is the performance of the 20% cheapest stocks, annually rebalanced.
Figure 6: Value Investing Results
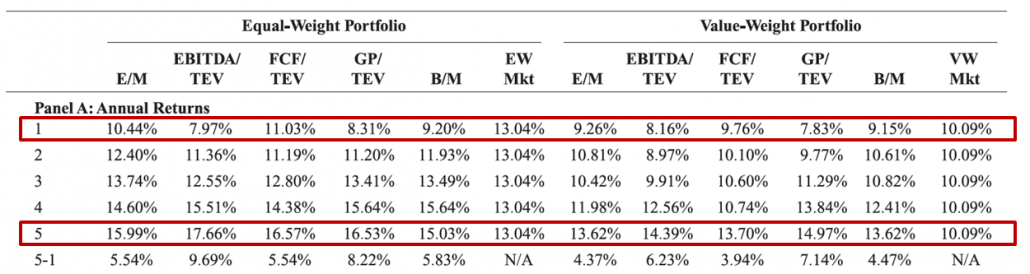
The results are hypothetical results and are NOT an indicator of future results and do NOT represent returns that any investor actually attained. Indexes are unmanaged, do not reflect management or trading fees, and one cannot invest directly in an index. Additional information regarding the construction of these results is available upon request.
What do you notice? Across the board, the historical evidence is clear: cheap stocks have outperformed expensive stocks–by a wide margin. The equally-weighted portfolio of cheap stocks measured by EBITDA/TEV earns a 17.66% compounded annual return, whereas, the most expensive stock portfolio earns 7.97%–nearly a 10% spread in performance. A spread of ~10% per year, compounded over a long time period, would lead to huge differences in the value of a portfolio.(5) This historical spread in returns, which has been repeatedly and consistently observed over time, has been labeled the value anomaly by academic researchers. Of course, academics argue over the reasons why the spread is large (e.g., value investing might earn higher returns because it is simply more risky or because of mispricing, as discussed earlier). This debate is best captured by a 2008 interview with Eugene Fama where he describes a personal conversation with Andrei Shleifer over a glass of wine. Fama highlights that Andrei believes the value premium is due to mispricing, whereas Fama attributes the value premium to higher risk.
Bottom line: Great minds can disagree on the explanation, but nobody can dispute the empirical fact that value stocks have outperformed growth stocks by a wide margin over time.
We Have the Facts. Next Step, Identify Bad Players
The data highlight that value investing has higher expected returns than growth investing. But to better understand whether value will beat growth in the future we need to look through the sustainable active investing prism and identify if the spread is due to risk (the efficient market explanation) or mispricing (the behavioral finance explanation). For a valid mispricing argument, we need to identify if there are market participants making systematically poor decisions with respect to the purchase of value and growth stocks.
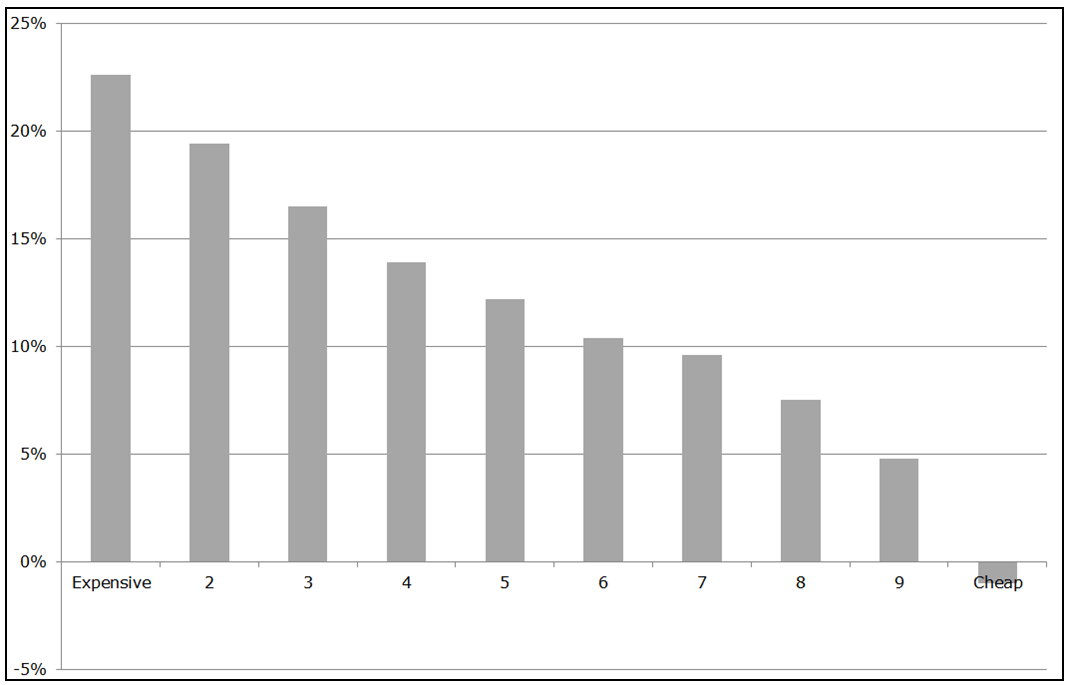
The poor poker players at the value investing table were first discussed by Lakonishok, Shleifer and Vishny (LSV) in their paper, “Contrarian Investment, Extrapolation, and Risk.” The poor behavior they investigate is referred to as representative bias, a situation where investors naively extrapolate past growth rates too far into the future. Figure 7 below highlights the concept from the LSV paper using updated data from Dechow and Sloan’s 1997 paper, “Returns to Contrarian Investment Strategies: Tests of Naive Expectations Hypothesis.” The horizontal axis represents cheapness and sorts securities into buckets based on expensive stocks (low book-to-market ratios) and cheap stocks (high book-to-market ratios). The vertical axis represents past 5 year earnings growth rates for the respective valuation buckets. Stocks in Bucket 10 are the cheapest, and they exhibited (on average) ~ a negative 1% earnings growth over the past five years.
The relationship is monotonic–almost perfectly linear. Cheap stocks have terrible past earnings growth, whereas expensive stocks have had wonderful earnings growth over the past 5 years. No real surprise there, but it is interesting to see how the data fits so well to this relationship.
Figure 7: Investors Extrapolate Past Growth Rates into the Future
The results are hypothetical results and are NOT an indicator of future results and do NOT represent returns that any investor actually attained. Indexes are unmanaged, do not reflect management or trading fees, and one cannot invest directly in an index. Additional information regarding the construction of these results is available upon request.
Figure 7 underscores the general market expectation that past earnings growth rates will continue into the future. Expensive firms are expensive because market participants believe past growth rates will continue. Otherwise why would you pay so much for these stocks? Meanwhile, cheap stocks are cheap for what seems like a good reason–the market believes their poor past growth rates will continue as well.
But does this really happen? Do cheap stocks have poor future growth and do expensive stocks have strong future growth? This is an empirical question that can be tested with an experiment. We can test whether or not this market assumption occurs, on average, OR if there is a systematic flaw in market expectations.
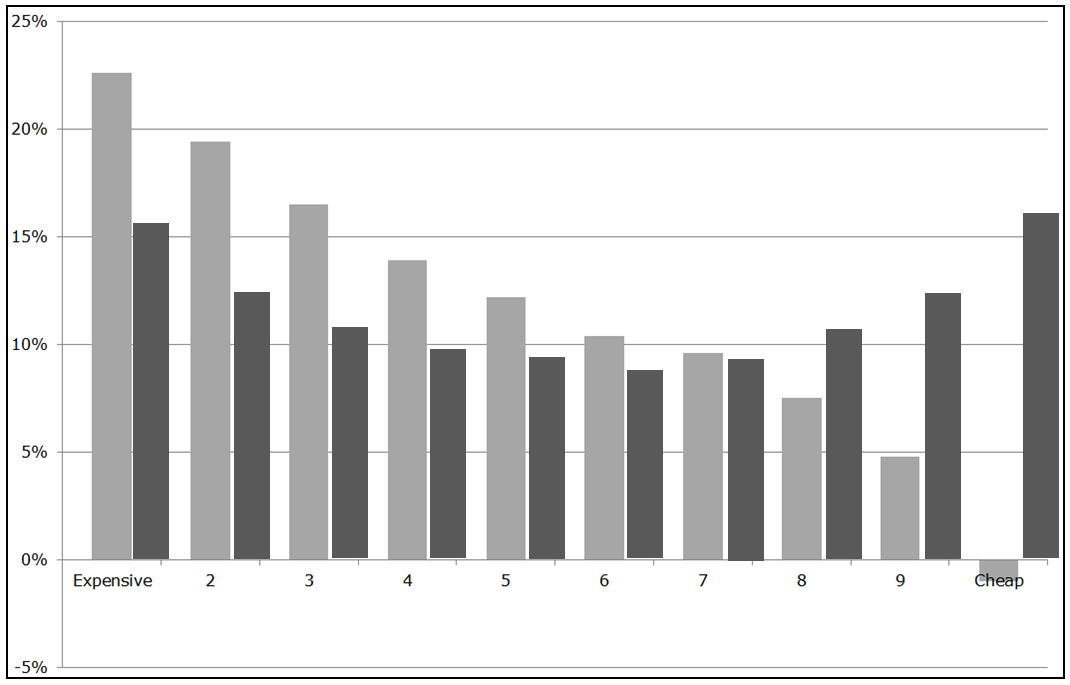
In Figure 8, we look at what happens to earnings growth over the next five years. Specifically, did the cheap stocks continue to exhibit terrible earnings growth as predicted? Did expensive stocks maintain their terrific earnings growth?
The chart below is evidence of systematically poor poker playing. The realized earnings growth (dark bars) systematically reverts to the average growth rate across the universe. Cheap stocks outperform growth expectations and expensive stocks underperform growth expectations, systematically. This unexpected deviation from expectations leads to price movements that are favorable for cheap “value” stocks, and unfavorable for expensive “growth” stocks. Growth investors underperform; value investors outperform; and passive investors receive something in between.
This behavioral phenomena explains much of the spread in returns between value and growth securities. We explore a related concept by Dechow and Sloan in the endnotes.(6)
Figure 8: Realized Growth Rates Systematically Mean-Revert
The results are hypothetical results and are NOT an indicator of future results and do NOT represent returns that any investor actually attained. Indexes are unmanaged, do not reflect management or trading fees, and one cannot invest directly in an index. Additional information regarding the construction of these results is available upon request.
To summarize: Markets, on average, throw value stocks under the bus and clamor for growth stocks. From a poker-playing perspective, buying growth stocks and selling value stocks is an example of a systematically poor strategy. Assuming that a great hand from the last round equals a winning hand in the next round is a losing approach. But what are the best poker players doing about this value anomaly situation, and can these poker players easily exploit the poor poker players?
Next Step: Identify the Actions of the Best Players
It is unlikely that we will ever be the smartest investors in the world. For example, George Soros, Julian Robertson, Leon Cooperman, and Paul Tudor Jones will always be smarter than we are. But if we aren’t going to be the best player at the investing table, how can we win against these high-powered investors? We can win by finding those market opportunities where the smartest investors are reluctant to participate. But why would a smart investor not want to participate in a straightforward way to beat the market, such as through value investing?
As mentioned previously, smart investors often get endowed with large amounts of capital from a large group of diverse investors (again, think George Soros, Julian Robertson, Paul Tudor Jones, but also large institutions such as BlackRock, Fidelity, and so forth). This makes sense on many levels—investors want to give their money to smart people. The challenge is that the really smart investors are often managing money on behalf of investors that suffer from behavioral biases (System 1 thinkers). Shleifer and Vishny highlight, and the Ken Heebner example confirms, that many smart market participants are hamstrung by the short-term performance measures imposed on them by their investors. “How did you perform against the benchmark this quarter? What do your results look like year to date? What macroeconomic trends are you exploiting this month?” All of these questions are commonplace in the market. The threat of being fired and replaced with a passive portfolio of Vanguard funds is an implied threat. When job security and client expectations trump long-term value creation, funny things happen.
A remarkable paper by Markus Brunnermeier and Stefan Nagel, “Hedge Funds and the Technology Bubble,” highlights the warped incentives faced by the smartest investors who deal with other people’s money. Contrary to all textbook teachings related to efficient price formation, the smart money sometimes can be incentivized to enhance mispricing, not trade against it! Brunnermeier and Nagel find that many hedge fund managers didn’t try to capitalize on the mispricing between value and growth stocks in the Internet Bubble of the late 1990s—they actually bought growth stocks and sold value stocks. This action enabled them to more closely track the index—for a time. Meanwhile, the poor hedge funds that stuck to their value investing guns, for example, Julian Robertson of Tiger Funds, ended up with no assets under management and a busted business model.
But Julian Robertson wasn’t the only famous value investor to lose his proverbial shirt during the 1994 to 1999 time period. Around this time, Barron’s famously stated the following regarding Warren Buffett’s relative performance:
Warren Buffett may be losing his magic touch.
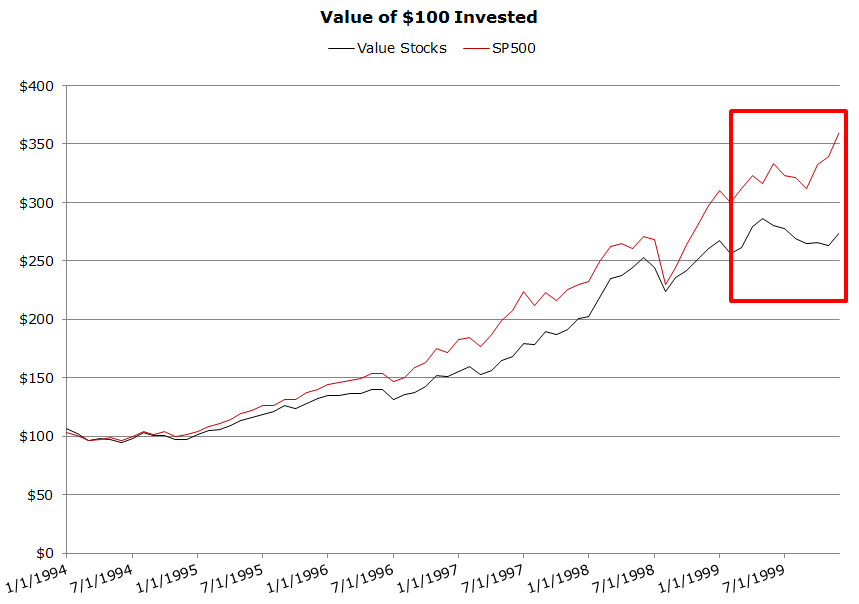
Barron’s observation was, in many respects, fully warranted. Value investors as a group were destroyed by the market in the late 1990s. Generic value investing (shown in Figure 9) underperformed the broader market by a large margin for six long years!
Figure 9: Value Investing Can Underperform
The results are hypothetical results and are NOT an indicator of future results and do NOT represent returns that any investor actually attained. Indexes are unmanaged, do not reflect management or trading fees, and one cannot invest directly in an index. Additional information regarding the construction of these results is available upon request.
Clearly, being a value investor requires the patience and faith that few investors possess. In theory, value investing is easy–buy and hold cheap stocks for the long haul–in practice, true value investing IS ALMOST IMPOSSIBLE.
Using Ken French’s data, we examined just how painful it was to be a value investor in the late ’90s.
We examine the returns from 1/1/1994-12/31/1999 for a Value portfolio (High B/M quintile, VW returns), Growth portfolio (Low B/M quintile, VW returns), Risk-Free return (90-day T-Bills), and SP500 total return. Results are shown in Figure 10 below. All returns are total returns and include the reinvestment of distributions (e.g., dividends). Results are gross of fees.(7)
Figure 10: Summary Statistics (1994-1999)
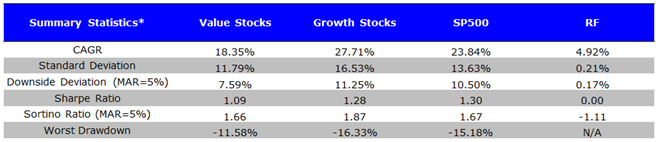
The results are hypothetical results and are NOT an indicator of future results and do NOT represent returns that any investor actually attained. Indexes are unmanaged, do not reflect management or trading fees, and one cannot invest directly in an index. Additional information regarding the construction of these results is available upon request.
Talk about a beat-down! Looking at the annual returns (shown in Figure 11), value investing lost almost every year to a simple market allocation!
Figure 11: Annual Returns
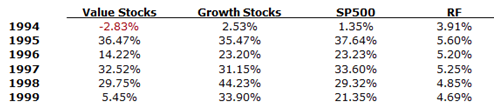
The results are hypothetical results and are NOT an indicator of future results and do NOT represent returns that any investor actually attained. Indexes are unmanaged, do not reflect management or trading fees, and one cannot invest directly in an index. Additional information regarding the construction of these results is available upon request.
A plain vanilla index fund outperforms value five out of six years in a row, sometimes by double-digit figures! To simulate what these value managers went through, ask yourself this question:
If your asset manager underperformed a benchmark for five years, at times by double digits, would you fire them?
For 99.9% of investors, that answer would be a resounding YES (and giving someone a six-year trial period to begin with is probably out of the question as well). Most–if not all–professional asset managers would be fired given this underperformance. Truly active value investing is practically impossible to follow for many pros.
After viewing the 5-year underperformance of value, we need to highlight 2 conclusions:
- For a long-term investor, a 5-year stretch of pain is a truly great thing. Why? Because the competition from the best pokers players is going to be limited, careers and tracking error trump performance!
- Sustainable active investing requires special clients. Disciplined investors with long term horizons that are indifferent to short-term relative performance are essential. These unique clients are what we label “Sustainable Clients” in Figure 5.
Now, suspend reality for a moment and let’s imagine that an active value manager had clients that didn’t flee for the exits in 1999. What would their hypothetical returns look like in the long run? As you can see below in Figure 12, value quickly recovers and outperforms the entire time period thereafter. Here are the returns to the same portfolios from 1/1/2000 – 12/31/2014, the 15 years following the 5-year underperformance:
Figure 12: Summary Statistics (2000-2014)
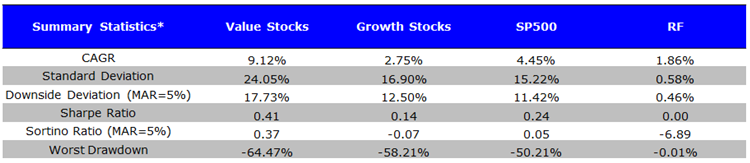
The results are hypothetical results and are NOT an indicator of future results and do NOT represent returns that any investor actually attained. Indexes are unmanaged, do not reflect management or trading fees, and one cannot invest directly in an index. Additional information regarding the construction of these results is available upon request.
Sticking with the value strategy, although painful, was richly rewarded with a 4.67%+ edge–per year–over the market benchmark from 2000-2014.
Over the entire cycle, patient, disciplined investors were also rewarded. Here are the results (Figure 13) over the entire time period, measured from 1/1/1994 to 12/31/2014:
Figure 13: Summary Statistics (1994-2014)
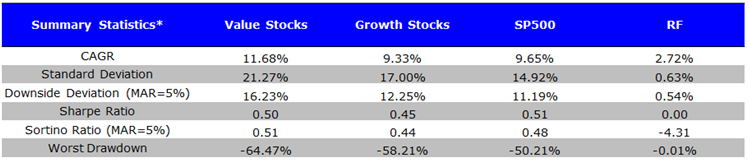
The results are hypothetical results and are NOT an indicator of future results and do NOT represent returns that any investor actually attained. Indexes are unmanaged, do not reflect management or trading fees, and one cannot invest directly in an index. Additional information regarding the construction of these results is available upon request.
What’s the bottom line? For a long-term investor, value investing was the optimal decision relative to growth investing, but for many of the smartest asset managers in the world, including the great Julian Robertson, value investing was simply not feasible as a business model. These professionals were often forced via the threat of investor redemptions to “diworsify” their portfolios with overpriced growth stocks during the Internet Bubble. They needed to keep up with the market and did so by doing what everyone else was doing. This decision helped them keep their jobs, but prevented their investors from maximizing their chances for success, even if some truly did have a long-horizon, and discipline.
Putting it all together
We’ve used value and growth investing as a laboratory to highlight how the sustainable active investing framework can identify long-term winning strategies. Value investing fits nicely in this paradigm but has serious warts, notably stretches of horrendous underperformance. The lesson from value investing is that successful active investing is simple, but not easy. If active investing were easy, everyone would do it, and if everyone were doing it, it probably would not generate outsized risk-adjusted returns over the long haul.
In summary, our long-term performance equation highlights 2 required elements:
- The sustainable process exploits systematic investor expectation errors.
- The sustainable investor has a long horizon and a willingness to be different.

These 2 pieces of the puzzle map back to the classic lessons of poker:
- Identify the worst poker player at the table.
- Identify the best poker player at the table.
And these classic lessons map into the 2 pillars of behavioral finance:
- Understand behavioral bias and how investors form expectations.
- Understand market frictions and how they affect market participants.
So the next time you hear a market participant suggest that one strategy is better than another strategy, simply ask two basic questions: (1) Why are the securities selected by this process mispriced? and (2) Why aren’t other smart investors already exploiting the mispricing opportunity? Without solid answers to both questions, it is unlikely that the investment process is sustainable.
And if you want to hear the same story from a much smarter person, check out Cliff Asness’ lecture at the 2014 Grant’s Interest Rate Observer Meeting. Scary stuff.

References[+]
| ↑1 | We use the terms active and passive in the traditional sense. See here for the financial definition of these terms. |
|---|---|
| ↑2 | Two Centuries of Price Return Momentum by Chris Geczy and Mikhail Samonov. |
| ↑3 |
Value Investors Club BackgroundValueinvestorsclub.com (VIC) is an “exclusive online investment club in which top investors share their best ideas.” Many business publications have heralded the site as a top-quality resource for those who can attain membership (e.g., Financial Times, Barron’s, BusinessWeek, and Forbes). Joel Greenblatt and John Petry, managers of a large hedge fund, Gotham Capital, founded the site in 2000 with $400,000 of start-up capital. Their goal was for VIC to be a place for the highest-quality ideas on the Web. The investment ideas submitted on the club’s site are broad but are best described as fundamentals-based. VIC states that it is open to any well thought out investment recommendation, but that it has particular focus on long or short equity or bond-based recommendations, traditional asset undervaluation situations, such as high book-to-market, low price-to-earnings, liquidations, etc., and investment ideas based on the notion of value as articulated by Warren Buffett (firms selling at a discount to their intrinsic value irrespective of common valuation ratios). VIC managers try to ensure that only members with significant “investment ability” are admitted to the club. Accordingly, membership in the club is capped at 250 and the approximate acceptance rate is 6% (Per email correspondence with VIC management). As a result of the low acceptance rate, membership started at 90 members in 2000 and did not reach the 250 cap until 2007. Admittance is based solely on a detailed write-up of an investment idea (typically 1000 to 2000 words). Employer background and prior portfolio returns are not part of the application process. If the quality of the independent research is satisfactory and the aspiring member deemed a credible contributor to the club, he is admitted. Once admitted, members are required to submit at least two “high-quality” investment ideas per year to continue as members and receive unrestricted access to the ideas and comments posted by the VIC community. |
| ↑4 | debatable that he actually said this: https://blogs.wsj.com/marketbeat/2011/02/11/keynes-he-didnt-say-half-of-what-he-said-or-did-he/ |
| ↑5 | The spread is obviously overstated after transaction costs and taxes, but highlights the point. |
| ↑6 |
Naive Forecasts or Naive Reliance of Bad Forecasts?Dechow and Sloan 1997 argue that the value anomaly is not driven by naive extrapolation by irrational investors as LSV 1994 suggested, but rather, the outperformance of value stocks is driven by market participants’ flawed faith in analysts forecasts, which are systematically overoptimistic. In Appendix Figure below, Dechow and Sloan look at the relationship between the earnings growth forecasted by sell-side analysts and the actual earnings growth (note, the sample used below is different than the sample above due to I/B/E/S data constraints). The chart below first splits firms into 10 buckets based on their price. The left bucket contains the most expensive firms, while the far right bucket contains the cheapest firms. The black bars represent past earning growth rates, while the blue bars represent future earning growth rates. What do we see? A few things:
Appendix Figure: Value Investing Results 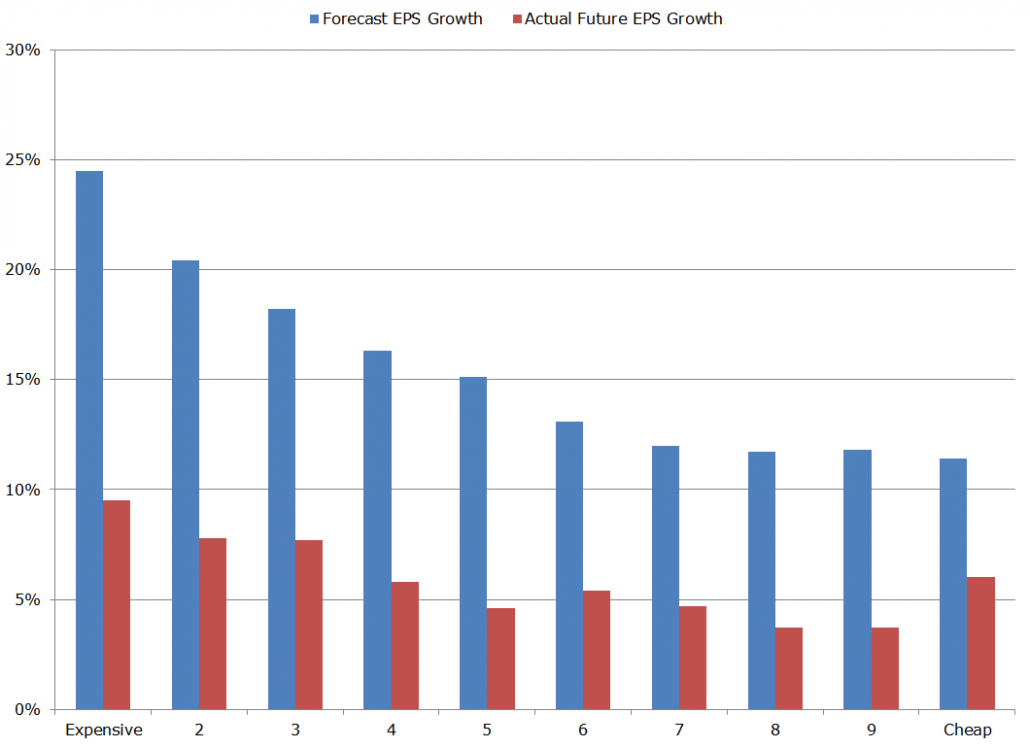 If investors anchor on sell-side expectations about the future, investors will be most surprised when the realized growth on expensive stocks underwhelms forecasts, and investors will be least surprised when the realized growth rates on cheap stocks underwhelm forecasts. |
| ↑7 |
Statistics Definitions
|
About the Author: Wesley Gray, PhD
—
Important Disclosures
For informational and educational purposes only and should not be construed as specific investment, accounting, legal, or tax advice. Certain information is deemed to be reliable, but its accuracy and completeness cannot be guaranteed. Third party information may become outdated or otherwise superseded without notice. Neither the Securities and Exchange Commission (SEC) nor any other federal or state agency has approved, determined the accuracy, or confirmed the adequacy of this article.
The views and opinions expressed herein are those of the author and do not necessarily reflect the views of Alpha Architect, its affiliates or its employees. Our full disclosures are available here. Definitions of common statistics used in our analysis are available here (towards the bottom).
Join thousands of other readers and subscribe to our blog.