It has been well-documented that value stocks have provided higher expected returns than growth stocks. However, there is a great debate about the source of that premium: Is it risk-based or is it related to behavioral errors that create persistent mispricings? There are many papers presenting arguments on both sides. Hence the debate.
Cathy Xuying Cao, Chongyang Chen and Vinay Datar contribute to the literature with their study, “Value Effect and Macroeconomic Risk,” which appears in the Fall 2017 issue of the Journal of Investing. They examined to what extent the value effect reflects macroeconomic risk — in other words, how the returns from value and growth strategies are sensitive to the change in macroeconomic conditions.
They used intuitive proxies for macroeconomic conditions: the growth rate of industrial production, the term premium, the default premium, and the changes in expected and unexpected inflation. If the value premium is driven by risk, value stocks should have more exposure to these metrics. To capture the value effect, they used two proxies: the book-to-market (B/M) equity ratio and earnings-to-price (E/P) ratio. Their data sample covers the period from July 1963 through June 2012.
The following is a summary of their findings:
- Value stocks have higher sensitivities than growth stocks to certain macroeconomic factors, specifically the growth rate of industrial production, the term spread, the default premium and unexpected inflation. The risk loadings of both high-B/M and low-P/E firms are substantially larger (and statistically significant) than the loadings of low-B/M firms with respect to each of the macroeconomic factors.
- The value premium changes with economic conditions and value strategies tend to underperform growth strategies during NBER-defined recession periods. For example, during the 2008 crisis, the cumulative investment return from a B/M value strategy was -58.8 percent while the return was -49.8 percent for a growth strategy.
- The average estimated R-squared value is at least 60 percent, suggesting that the factors can explain a large proportion of the variation in the average returns of the portfolios. The positive risk premiums for industrial production and default risk indicate that typical investors want to insure against real systematic production shocks and against the unanticipated increase in default uncertainty.
Cao, Chen and Datar concluded:
The evidence suggests that macroeconomic risk plays a central role in driving the positive value-return relation…. Our evidence supports the risk-based explanation for the value premium.
Importantly, they add:
Value investment is often perceived to be safer than growth investment. Our results suggest differently: Value investment has greater risk exposure to macroeconomic risk than growth investment. The higher return that value investors achieve is at the cost of bearing higher exposure to unanticipated macroeconomic shocks.
Is the Value Premium Really Driven By Macro Risk?
As previously mentioned, there are many other papers providing support for the risk-based explanation of the value premium. In our book, “Your Complete Guide to Factor-Based Investing,” Andrew Berkin and I reviewed some of the literature providing this support. The following is taken from our book.
Supporting Evidence
Nai-fu Chen and Feng Zhang, authors of the 1998 paper “Risk and Return of Value Stocks,” make the case that value stocks do contain a distress (risk) factor. They examined three intuitive measures of distress present in value companies: cutting dividends by at least 25 percent, a high ratio of debt to equity, and a high standard deviation of earnings.
Chen and Zhang found that the three measures all captured the returns information (produced high correlations) contained in portfolios as ranked by B/M. When these three metrics were present, returns were greater. Because all three measures have simple, intuitive risk interpretations by virtue of their association with firms in distress, the authors state that it is not surprising the risk factors they studied were both highly correlated and were also highly correlated with B/M rankings. Their conclusion was that value stocks are cheap because they tend to be firms in distress, with high leverage, and that face substantial earnings risk. They, therefore, provide higher returns due to the greater risks facing value investors.
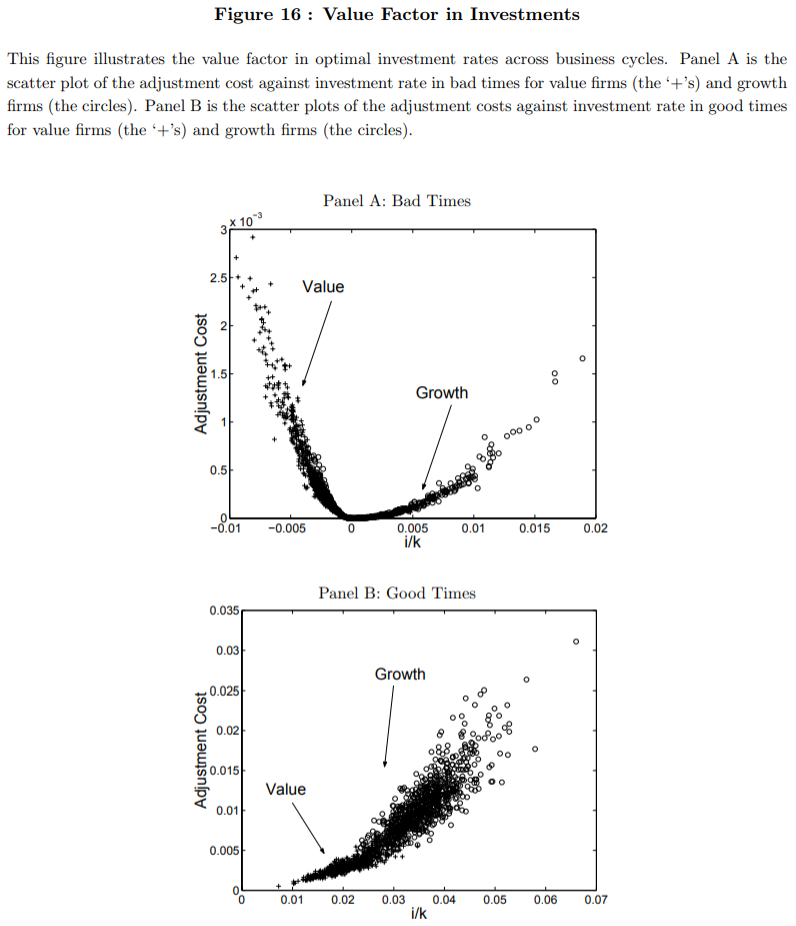
Next, we look at the 2005 study by Lu Zhang, “The Value Premium.” He concluded that the value premium could be explained by the asymmetric risk of value stocks. (Wes has an extended interview with Prof. Zhang here if one is interested in the discussion.) Value stocks are much riskier than growth stocks in bad economic times and only moderately less risky than growth stocks in good times. Zhang explains that the asymmetric risk of value companies exists because value stocks are typically companies with unproductive capital.
The figure below, taken from the study, highlights the core issue via a visualization:
The results are hypothetical results and are NOT an indicator of future results and do NOT represent returns that any investor actually attained. Indexes are unmanaged, do not reflect management or trading fees, and one cannot invest directly in an index. Additional information regarding the construction of these results is available upon request.
Asymmetric risk is important because of the following:
- Investment is irreversible. Once production capacity is put in place, it is very hard to reduce. Value companies carry more nonproductive capacity than growth companies.
- In periods of low economic activity, companies with nonproductive capacity (value companies) suffer a greater negative impact in earnings because the burden of nonproductive capacity increases, and they find it more difficult than growth companies to adjust capacity.
- In periods of high economic activity, the previously nonproductive assets of value companies become productive while growth companies find it harder to increase capacity.
- In good times, the capital stock is easily expanded. In bad times, adjusting the level of capital is an extremely difficult task — especially so for value companies.
When these facts are combined with a high aversion to risk (especially when that risk can be expected to show up in difficult economic times, when investors’ employment prospects are more likely to be in jeopardy), the result is a large and persistent value premium. This is consistent with the results of Motohiro Yogo’s 2006 study, “A Consumption-Based Explanation of Expected Stock Returns.” Similar to his results for small-cap stocks, Yogo found that value stocks deliver low returns during recessions, when the marginal utility of consumption is highest. In other words, the returns of value stocks are more pro-cyclical than growth stocks. Thus, investors must be rewarded with high expected returns to hold these risky stocks.
But Wait, There’s More…
We next examine a 2005 study, “Is the Book-to-Market Ratio a Measure of Risk?” The authors, Robert F. Peterkort and James F. Nielsen, developed a leverage-based approach to investigate the B/M effect. Because leverage is risky, it is not surprising that they found a positive relationship between higher stock returns and market leverage. Their regression results also showed that, when compared with market leverage, the B/M ratio added a small amount of explanatory power for stock returns. They wrote that they believe the incremental explanatory power of the B/M ratio is due to additional information about the riskiness of the firm’s assets. Thus, they concluded that B/M effect is mostly a leverage (risk) effect. The authors had another interesting finding. When they considered only companies they called “all-equity” firms (those with minimal amounts of mostly current debt, as opposed to long-term liabilities), there was no B/M effect at all. If the value premium is an anomaly, the mispricing should show up in all high-B/M firms, not just those with high leverage. These findings are consistent with those in Ralitsa Petkova’s 2006 study, “Do the Fama-French Factors Proxy for Innovations in Predictive Variables?”
Petkova found that value companies tend to be firms under distress, with high leverage and high uncertainty of cash flow. Therefore, shocks to the default spread (the spread between bonds of higher-rated credit and bonds of lower-rated credit) explain the cross-section of returns and is consistent with value being a measure of distress risk. In addition, growth stocks are high-duration assets (much of their value comes from expected future growth), making them similar to long-term bonds. Value stocks, on the other hand, are low-duration assets, making them more similar to short-term bonds. Thus, shocks to the term spread (the difference between short-term bonds and long-term bonds) also explain the cross-section of returns, and is further consistent with value being a measure of distress risk.
Next, we look at the 2014 study “Value Premium and Default Risk,” which covered the period from 1927 through 2011. The authors, Mohammed Elgammal and David G. McMillan, found a “positive relationship between default risk and the value premium for both large and small firms together with a leverage effect.”
They concluded:
The results show a positive association between the default premium and the value premium accompanied with evidence for a leverage effect on the value premium. This lends support to the risk-based explanation for the source of value premium. That is, where the default premium captures systematic risk in the macroeconomy and that the value premium is associated with rational decision making on the part of investors. Value stocks characterized by poor performance, earnings and profitability compared with growth stocks are more vulnerable to the risk of default and lead the investors to require a higher return on value stocks as leverage increases.
These papers demonstrate the link between value stocks and financial distress at the asset level. Value stocks are not simply great bargains waiting to be scooped up as free money. Rather, they are cheap for a reason — a reason related to their riskiness.
Finally, we have the study, “The Value Premium and Economic Activity: Long-Run Evidence from the United States.” To test the validity of the risk explanation, the authors, Angela J. Black, Bin Mao and David G. McMillan, examined the relationship between the value premium and macroeconomic variables, such as industrial production, inflation, money supply and interest rates. Their study covered the period from 1959 through 2005.
The following is a summary of their findings:
- First, in times of economic expansion, when industrial production rises, value stocks become less risky relative to growth stocks. Thus, the prices of value stocks increase more than the prices of growth stocks. The result is that the spread between high book-to-market and low book-to-market stocks narrows and the value premium declines. In bad times, value stocks become riskier relative to growth stocks. The result is that the prices of value stocks decrease faster than growth stocks, and the value premium increases (a sign of increased risk). Therefore, there is a negative relationship between the value premium and industrial production. This certainly was the case in the most recent recession, which lasted from December 2007 through June 2009, when the value premium was -0.44 percent per month.
- Second, a similar, negative relationship exists between the value premium and the money supply. Following an increase in the money supply, stock prices increase. The prices of value stocks tend to increase more than growth stocks, and the value premium shrinks. When money supply decreases, stock prices decrease, with the prices of value stocks decreasing more than growth stocks, and the value premium increases.
- Third, there is a positive relationship between the value premium and interest rates. As long-run interest rates rise, stocks become less attractive than bonds and stock prices decrease, with the prices of value stocks decreasing faster than the prices of growth stocks. That leads to an increasing value premium. When interest rates fall, the prices of value stocks increase faster than the prices of growth stocks. This leads to a decreasing value premium.
Overall, Black, Mao and McMillan found that value stocks are more sensitive to bad economic news, whereas growth stocks are more sensitive to good economic conditions. They concluded that the value premium is largely based on fundamental risk factors within the economy and arises from macroeconomic risk.
Summary
The bottom line is that there are very simple and logical risk-based explanations for the existence of a value premium. However, there is also strong support in the literature for behavioral explanations. So, what conclusion should we draw? To me, the answer is simple: It’s not a black or white issue. It’s possible, and in my opinion highly likely, that both risk and behavioral errors contribute to the premium. In other words, the value premium isn’t a free lunch, though it just might be a free stop at the dessert tray.

Source: Alpha Architect

About the Author: Larry Swedroe
—
Important Disclosures
For informational and educational purposes only and should not be construed as specific investment, accounting, legal, or tax advice. Certain information is deemed to be reliable, but its accuracy and completeness cannot be guaranteed. Third party information may become outdated or otherwise superseded without notice. Neither the Securities and Exchange Commission (SEC) nor any other federal or state agency has approved, determined the accuracy, or confirmed the adequacy of this article.
The views and opinions expressed herein are those of the author and do not necessarily reflect the views of Alpha Architect, its affiliates or its employees. Our full disclosures are available here. Definitions of common statistics used in our analysis are available here (towards the bottom).
Join thousands of other readers and subscribe to our blog.