In perfectly efficient markets, option prices should not convey any new information or contribute to the price discovery of underlying assets. However, if markets are not perfectly efficient, traders with private information might prefer to transact in option markets over stock markets even though option markets are less liquid than the markets in the underlying stocks. The reason for the preference is that options provide the investor with leverage (on average, stock prices are about 24 times greater than option prices), and the more out-of-the-money the strike price, the greater the leverage. If informed investors gravitate toward options that offer greater leverage (a wider gap between the strike price and the spot price), more relative trading activity in such options would provide information on future stock returns (higher returns for calls and lower returns for puts).
That’s the theory.
Prior to October 2000, when the SEC implemented Regulation Fair Disclosure, or Reg FD, many companies released important information in meetings and conference calls, where shareholders and the general public were excluded. This allowed those with the information to exploit it, especially through the use of out-of-the-money options. The goal of Reg FD was to level the playing field between individual investors and institutional investors: Companies that conduct earnings and forecast calls to update stock analysts must simultaneously issue a press release to make that information available to the general public.
Unfortunately, due to the lack of good databases of historical option prices, only in the last 15 years have researchers been able to test whether option prices and trading activity inform future prices.
We previously covered the long-standing paper, “The Joint Cross Section of Stocks and Options” by An, Ang, Bali, and Cakici, which showed that changes in implied volatility predict stock price changes. However, Kelley Bergsma, Vivien Csapi, Dean Diavatopoulos, and Andy Fodor contribute to the literature on the informational value of option prices and trading activity with their January 2020 study “Show Me the Money: Option Moneyness Concentration and Future Stock Returns.” Their database covers the period 2006 through 2017. Their daily option data is from OptionMetrics and includes bid and ask quotes, open interest, trading volume, strike prices, exercise dates, and implied volatilities for all U.S. exchange-traded options.
The authors began by noting the following:
Informed traders often use options that are not in-the-money due to higher potential gains for a smaller upfront cost. Thus, trading activity by option moneyness should be a gauge of informed option trading. Show Me the Money: Option Moneyness Concentration and Future Stock Returns
To test this hypothesis, they constructed a dollar volume-weighted average moneyness measure (AveMoney) that captures option trading activity at different moneyness levels. They found that “stock returns do increase with this measure, suggesting informed option traders prefer options that offer higher leverage and such trading activity predicts next day stock returns.” They added: “Our results for call options hold at the monthly level as well.”
Specifically, they found:
- When calculating AveMoney, there is a monotonic relationship between AveMoney quintile and future daily stock return, where the Low AveMoney portfolio daily return is 1.2 basis points (bps) and the High AveMoney portfolio return is 4.4 bps. The High-Low portfolio difference is a statistically significant 3.2 bps (t = 4.40).
- When AveMoney is calculated using only call options, an even stronger monotonic relationship between Call AveMoney and daily stock returns exists, where the Low AveMoney portfolio daily return was 0.6 bps and the High AveMoney portfolio daily return was 6.1 bps. The High-Low Call AveMoney portfolio difference is a highly significant 5.4 bps (t = 7.44). This result is consistent with informed traders choosing calls with higher leverage to bet on future stock price increases.
- There was no statistically significant relationship found with puts.
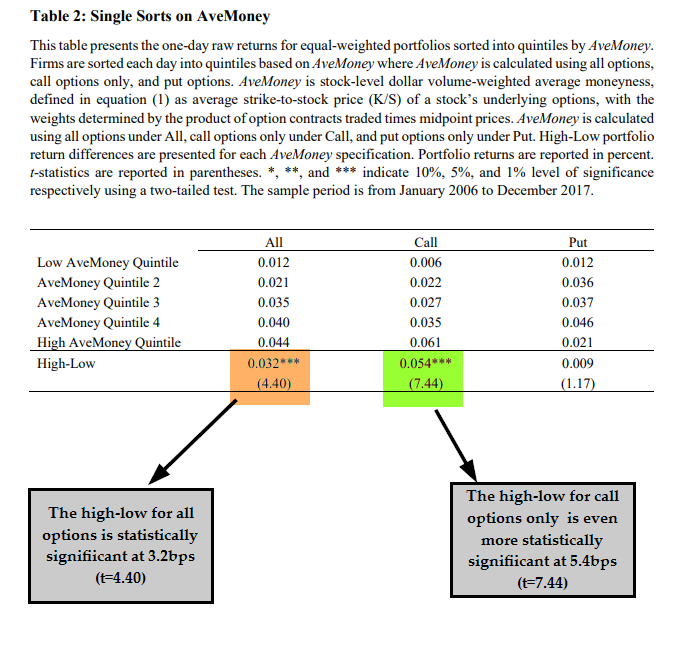
These results led the authors to conclude that “the significant High-Low portfolio difference for AveMoney using all options is driven by the strong results for calls. This evidence suggests more dollar volume in call options with higher strike prices (more trading in out-of-the-money calls with higher leverage) predicts higher future daily stock returns.” They hypothesized that the weak evidence for puts results from their use of more hedging, while calls are more often used for speculating on future stock price movements.
Bergsma, Csapi, Diavatopoulos, and Fodor also investigated whether their measure has greater predictive power for returns of stocks with higher implied volatility (which reflects greater investor uncertainty about future stock prices). Greater uncertainty should lead to a higher discount rate for such firms. Thus, investors who are informed about the true value of the underlying stock have higher potential gains. Consistent with this hypothesis, they found that the economic impact of AveMoney was strongest among stocks with high implied volatility (IV)—the High-Low Call AveMoney difference was 13.1 bps (t = 3.86) for the high IV quintile, or 33 percent a year (the results for puts were again insignificant). Once again, they acknowledged that the transaction costs for a daily rebalanced portfolio would be substantial. However, they did note (in unreported results) that they found that even a monthly rebalanced portfolio (which would lower turnover and trading costs) was significantly profitable.
The authors also noted that “prior literature suggests that changes in option open interest are related to future stock returns. … If investors are informed, it is reasonable to conjecture that they are more likely to open new contracts, rather than close existing contracts.” They confirm this, finding that the greatest increases in open interest are associated with the strongest stock return predictability for their average moneyness measure. However, the results were significant only for calls, not puts.
And finally, the authors investigated whether their results were explained by other common factors. They found a Fama-French five-factor alpha of 12 percent per year for all stocks and 33 percent per year for high implied volatility stocks. However, they emphasized that the alphas were gross, not net. And the lack of liquidity in these markets and the high turnover required would significantly impact the alphas. They noted: “We acknowledge that daily rebalancing of this long-short portfolio would generate transaction costs that would subsume the portfolio’s alpha.”
These findings are supported by those of Vinay Patel, Tālis Putniņš, David Michayluk, and Sean Foley in their paper “Price Discovery in Stock and Options Markets” (published in the January 2020 issue of the Journal of Financial Markets).
Further Evidence
Patel, Putniņš, Michayluk, and Foley examined the performance of 35 large U.S. stocks with actively traded options over the 10-year time period April 17, 2003, to April 17, 2013, and found that “approximately one-quarter of the time new information is impounded into option prices first and then transmitted to stock prices.”
Of particular interest is that they also drew on a unique dataset of illegal insider trading prosecutions to supplement their price discovery results. They hand-collected every case of insider trading prosecuted by the SEC during the 16-year period from January 1999 to August 2014. The database covered 539 news announcements that were preceded by illegal trading on insider information. They found 29 percent of the cases and 32 percent of illegal insider trades took place in options. “When insiders trade in both the stock and options markets, the average volume traded in the options market is approximately 50% of their total traded volume.” These trades earn huge profits. The authors continued: “Insiders that trade only in stocks earn an average of 24% on the traded value, insiders that trade in both stocks and options earn 39%, and insiders that only trade in options earn an average return of 353%.” They concluded: “The substantial number of insider trading cases that involve trading in options nevertheless supports the notion that informed traders use options markets in addition to stock markets.”
The authors also found that price discovery in options increases around information events (such as merger announcements): “This evidence supports the growing number of studies that find abnormal price and/or volume movements in options around a variety of important announcements. Our evidence supports the conjecture that these abnormal patterns are associated with informed trading in the options market.”
The authors also noted that options markets are considerably less liquid than the market for stocks, with both wider bid-ask spreads and lower trading activity. Thus, trading costs are much higher. However, the leverage provided by out-of-the-money options attracts informed investors who are willing to bear higher trading costs. The lower levels of liquidity also make the markets more “noisy,” making it harder to discern whether a price movement is temporary or permanent. To address this, they developed a test that allowed them to separate price action into the two categories—temporary noise action and permanent action that contains information. They concluded that “this obfuscation of the information leadership component due to a high level of noise in options prices is why options can appear to make little contribution to price discovery despite evidence that a significant amount of informed trading occurs in options.”
Summary
These two studies demonstrate that option prices, and option trading activity, provide some additional information on asset prices and future returns. That said, the high costs of trading in the less liquid option markets, along with the high turnover required, can cause any premium to vanish. However, that doesn’t mean that a fund manager could not use the information. Consider momentum strategies, which tend to have high turnover which can minimize, if not eliminate, their benefits. Fund managers can use momentum signals to actually reduce turnover by delaying trades they would otherwise make. For example, an index-like fund could delay the sale of a stock that has left its eligible universe due to recent price momentum. It would only execute the trade once the positive or negative momentum had ceased. Similarly, a fund could delay the sale of a stock where unusual call option activity was occurring. This would allow the fund to capture the higher expected return without incurring additional trading costs. Additionally, the research suggests regulators interested in insider trading should be looking closely at the options markets.

About the Author: Larry Swedroe
—
Important Disclosures
For informational and educational purposes only and should not be construed as specific investment, accounting, legal, or tax advice. Certain information is deemed to be reliable, but its accuracy and completeness cannot be guaranteed. Third party information may become outdated or otherwise superseded without notice. Neither the Securities and Exchange Commission (SEC) nor any other federal or state agency has approved, determined the accuracy, or confirmed the adequacy of this article.
The views and opinions expressed herein are those of the author and do not necessarily reflect the views of Alpha Architect, its affiliates or its employees. Our full disclosures are available here. Definitions of common statistics used in our analysis are available here (towards the bottom).
Join thousands of other readers and subscribe to our blog.