The Asset Growth Effect in Stock Returns
- Michael Cooper, Huseyin Gulen, and Michael Schill
- A version of the paper can be found here.
Abstract:
We document a strong negative relationship between the growth of total firm assets and subsequent firm stock returns using a broad sample of U.S. stocks. Over the past 40 years, low asset growth stocks have maintained a return premium of 20% per year over high asset growth stocks. The asset growth return premium begins in January following the measurement year and persists for up to five years. The firm asset growth rate maintains an economically and statistically important ability to forecast returns in both large capitalization and small capitalization stocks. In the cross-section of stock returns, the asset growth rate maintains large explanatory power with respect to other previously documented determinants of the cross-section of returns (i.e., size, prior returns, book-to-market ratios). We conclude that risk-based explanations have some difficulty in explaining such a large and consistent return premium.
Data Sources:
The authors examine all non-financial U.S stocks listed on NYSE/AMEX/NASDAQ from June 30th 1968 through June 30th 2007. To be included in the analysis companies must have stock return data from CRSP and total assets data from Compustat. The authors also require that firms be listed on Compustat for two years to be in the sample.
Discussion:
Never has an academic finance paper reminded me of my time in the United States Marine Corps. And yet, this paper pulled it off! In the military, any formal presentation has to begin with a “BLUF,” or the Bottom Line Up Front. Taking a page out of the DOD playbook, the writers start this paper off with the best BLUF I’ve ever seen in a academic research article:
“Suppose that on June 30th of each year from 1968 to 2006 an investor sorted U.S. stocks into ten equal portfolios based on the past year’s percentage change in total corporate assets. If the investor bought the stocks with the highest past growth in assets, the mean annual portfolio return over the 39 year period would have been just 4%. If, alternatively, the investor bought the stocks with the lowest past growth in assets, the mean annual portfolio return would have been 26%.”
Wow, Buffett-like returns minus the maestro’s touch. And all of this is generated using a very simple asset growth measure:
Asset Growth (t) = (Total Assetst -Total Assetst-1)/ Total Assetst-1
The authors form ten equally-weighted portfolios based on the rate of asset growth each year for forty years, rebalancing in June. For example, the portfolio formed in June 1970 would be based on the asset growth from balance sheet data from December 1969 to December 1970 (the 6-month delay between portfolio formation date and the asset growth calculation date is in place to ensure the portfolio formation data was known to the market).
Here are the stats for all you “quants” out there who enjoy monthly alpha estimates:
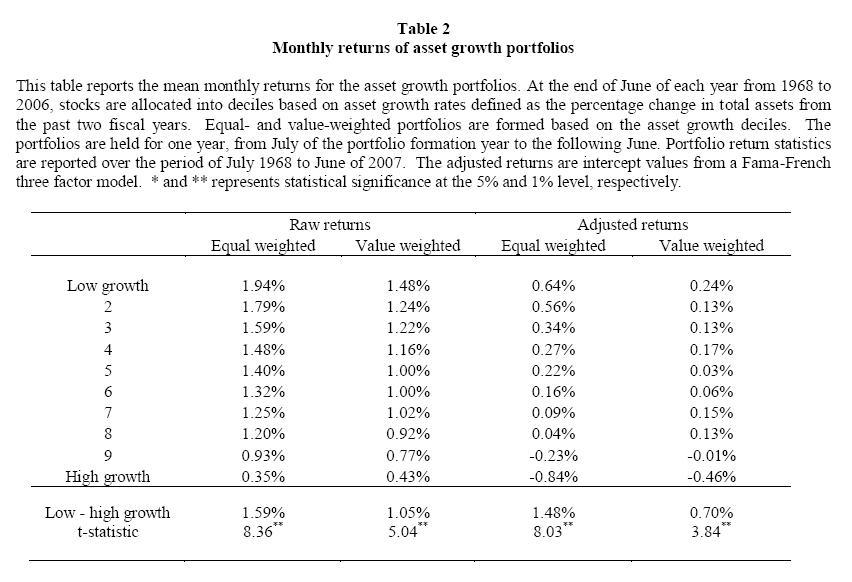
The results are hypothetical results and are NOT an indicator of future results and do NOT represent returns that any investor actually attained. Indexes are unmanaged, do not reflect management or trading fees, and one cannot invest directly in an index. Additional information regarding the construction of these results is available upon request.
The long/short system, rebalanced annually to equal-weight, earns 1.48% a month “alpha” on average–holy cow!
And for a more intuitive look at the performance of the strat, here is the table of the annual buy-and-hold returns to the asset growth strategy:
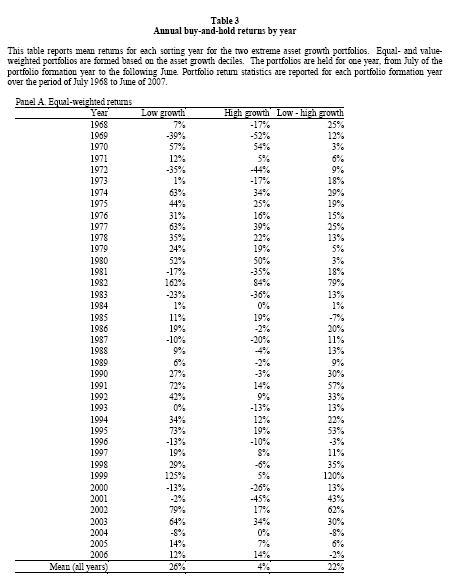
The results are hypothetical results and are NOT an indicator of future results and do NOT represent returns that any investor actually attained. Indexes are unmanaged, do not reflect management or trading fees, and one cannot invest directly in an index. Additional information regarding the construction of these results is available upon request.
Results like this are nothing short of amazing…
So what’s the catch?
Risk-based arguments suggest that firms with growth options (low asset growth firms) are riskier than firms that have converted their growth options into assets (high asset growth firms). In this framework it should be the case that firms which are exercising their growth options (and thus growing their asset bases) are less risky and have lower expected returns than the firms who are sitting on their growth options and refraining from investment (or at least that is the theory).
One “irrational market” explanation for the underperformance of high asset growth firms is that high asset growth firms need capital to fund their growth, and these firms quickly become friends with Wall Street investment bankers. The bankers then market the firms, drive their prices to irrational levels, and rake a hefty piles of fees into their coffers along the way. In such a world (let’s call this theoretical world, “reality”), high asset growth firms become overvalued and low asset growth firms stay undervalued.
So it this a rational risk premium story or an irrational market story?
The empirical evidence presented in this paper contradicts this risk-based theories and suggests there are substantially higher profit opportunities in low asset growth firms. Further, many of the implications of this evidence are directly at odds with many common assumptions of the risk/return relationship. The following points highlight just how silly “risk-based” arguments are when it comes to explaining the asset growth anomaly:
- High growth firms earn the same returns as treasury bills (~4% over the sample period).
- Investors earn over a 20% premium for holding low asset growth firms.
- Standard asset-pricing models cannot explain the returns (e.g., CAPM, Fama-French)
- Low-growth firms outperform on earnings releases and high growth firms underperform on earnings releases, suggesting that the market is systematically “surprised” by the fundamentals underlying high- and low-growth firms.
- The asset growth anomaly performs better in bull markets and less-bad in bear markets.
Investment Strategy:
- Calculate asset growth of all firms in June
- Identify the 10% of firms with the highest asset growth and the 10% of firms with the lowest asset growth.
- Buy the lowest asset growth firms and go short the highest asset growth firms.
- Repeat/rebalance each June.
- Make money.
Commentary:
Strategies this simple with such high returns make me queasy. I know the evidence is legit, but any good trader, entrepreneur, or biological organism that has ever dealt in a world full of competition knows that nothing in life is free. And yet, the simplicity and amazing returns of this strategy cannot go by without notice.
My gut tells me there is an aspect of data-mining involved in this system, despite the excellent empirical work performed by the authors. Nonetheless, researchers, using equally-valid and sophisticated statistical techniques have found that sunspots also predict stock prices (and let’s not forget the infinite monkey theorem).
Then again, the simple story that Wall Street bankers screw over investors is about the most robust “fact” I know of in the stock market. So maybe it is the case these high growers are getting promoted and simultaneously reamed by Wall Street, whereas the slow growers are being left to their own devices to generate cash flow and increase operational efficiency.
Let’s make money. Go asset growth anomaly!

About the Author: Wesley Gray, PhD
—
Important Disclosures
For informational and educational purposes only and should not be construed as specific investment, accounting, legal, or tax advice. Certain information is deemed to be reliable, but its accuracy and completeness cannot be guaranteed. Third party information may become outdated or otherwise superseded without notice. Neither the Securities and Exchange Commission (SEC) nor any other federal or state agency has approved, determined the accuracy, or confirmed the adequacy of this article.
The views and opinions expressed herein are those of the author and do not necessarily reflect the views of Alpha Architect, its affiliates or its employees. Our full disclosures are available here. Definitions of common statistics used in our analysis are available here (towards the bottom).
Join thousands of other readers and subscribe to our blog.