Have Goodwill Accounting Gone Bad?
- Kevin Li and Richard Sloan
- A version of the paper can be found here.
- Live implementation data can be found at Empirical Finance Data™ (Expected Q2 2011)
Abstract:
SFAS 142 replaces the systematic amortization of goodwill with a periodic impairment test. We examine the impact of this standard on the accounting for and valuation of goodwill. Our results indicate that the new accounting results in inflated goodwill balances and untimely impairments. Goodwill impairments lag deteriorating operating performance and stock returns by at least two years. Moreover, investors do not appear to fully anticipate the delayed goodwill impairments, since firms with deteriorating operating performance and large goodwill balances have both predictable future impairments and negative abnormal stock returns. Overall, our results suggest that management exploits the discretion afforded by SFAS 142 to delay goodwill impairments and that this causes earnings and stock prices to be temporarily inflated.
Data Sources:
The authors use Compustat Xpressfeed to obtain accounting data including annual goodwill data and quarterly goodwill impairment. Return data are obtained from CRSP. The time period analyzed for the trading strategy is from 2003-2009.
Discussion:
CEOs love to play games with other people’s money.
Standardized accounting rules are theoretically supposed to increase transparency and help investors identify managers who are engaging in nefarious activity. Unfortunately, the system isn’t perfect.
In this paper, the authors look at the accounting of goodwill to determine if the market can identify when managers are using the accounting rules to manipulate their earnings.
There are really three ways in which a manager can account for goodwill:
- Expense the cost in the current period–this will kill earnings in the short-term, and overstate earnings in the future.
- Amortize the cost of the intangible asset over the asset’s anticipated lifetime–this method assumes each time period gets equal benefits from the asset.
- Periodically test the asset’s value and impair accordingly–if the asset is no longer valuable, write it off, if the asset has not been impaired, don’t take a charge.
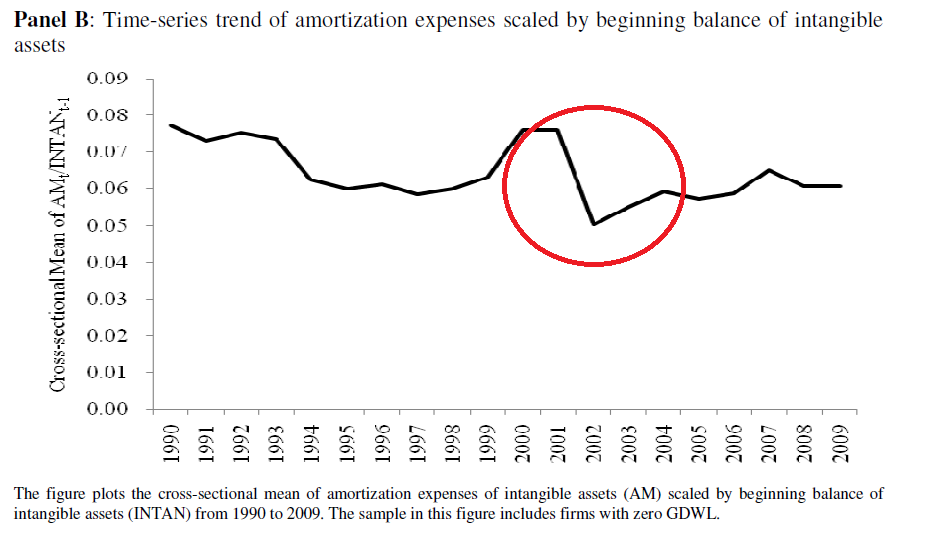
Option 2 seems to be reasonable, since it is systematic and hard to manipulate. The biggest fear is that managers may over/under estimate the long-term life of goodwill, but luckily, there are rules in place telling managers how long certain assets will live (e.g., you can’t tell investors your 1980 Chevy pickup has a useful life of 100 years).
Of course, option 2 can also be prohibitive in the case of goodwill: imagine if someone purchases Coca-Cola’s brand name. Is it really the case that Coke’s brand name value will systematically decrease over a set number of years? Hasn’t happened yet.
So perhaps option 3 is a better alternative: let managers assess at pre-determined time intervals what the value of goodwill should be. If the Coca-Cola brand is still rocking and rolling, there would logically be no impairment; however, Atari or Sega should probably eliminate any goodwill associated with their video game brands. SFAS 142 mandates option 3, because it does a lot better job at reflecting economic realities than either option 1 or 2 mentioned above…
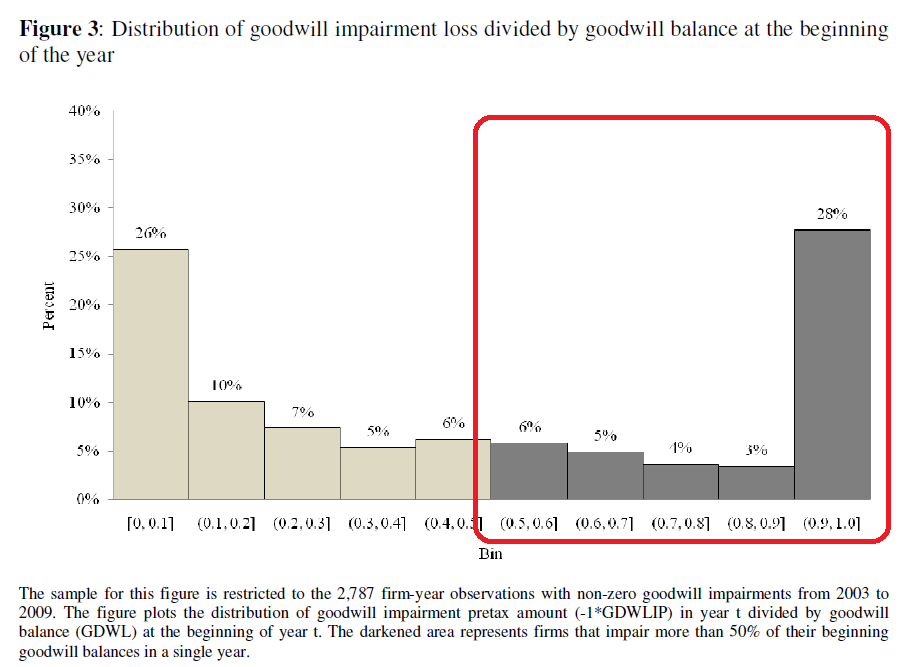
Next, the authors look at the post SFAS 142 period and see how often firms engage in goodwill “write-off baths.” Under SFAS 142, one would expect goodwill write-offs to come gradually because goodwill assets typically do not die off in a single year–it takes a while for a brand or intellectual edge to be impaired. Of course, if managers decided to not take amortization expense over the previous years to increase their pay, and instead take a “bath” all at once when goodwill game could no longer be played, we’d see a situation where managers rarely take goodwill impairments, and then suddenly write-off goodwill in large chunks. This is exactly what the authors find–46% (28+3+4+5+6) of the time goodwill impairments are 50% or greater!
The results are hypothetical results and are NOT an indicator of future results and do NOT represent returns that any investor actually attained. Indexes are unmanaged, do not reflect management or trading fees, and one cannot invest directly in an index. Additional information regarding the construction of these results is available upon request.
So how can we make some money?
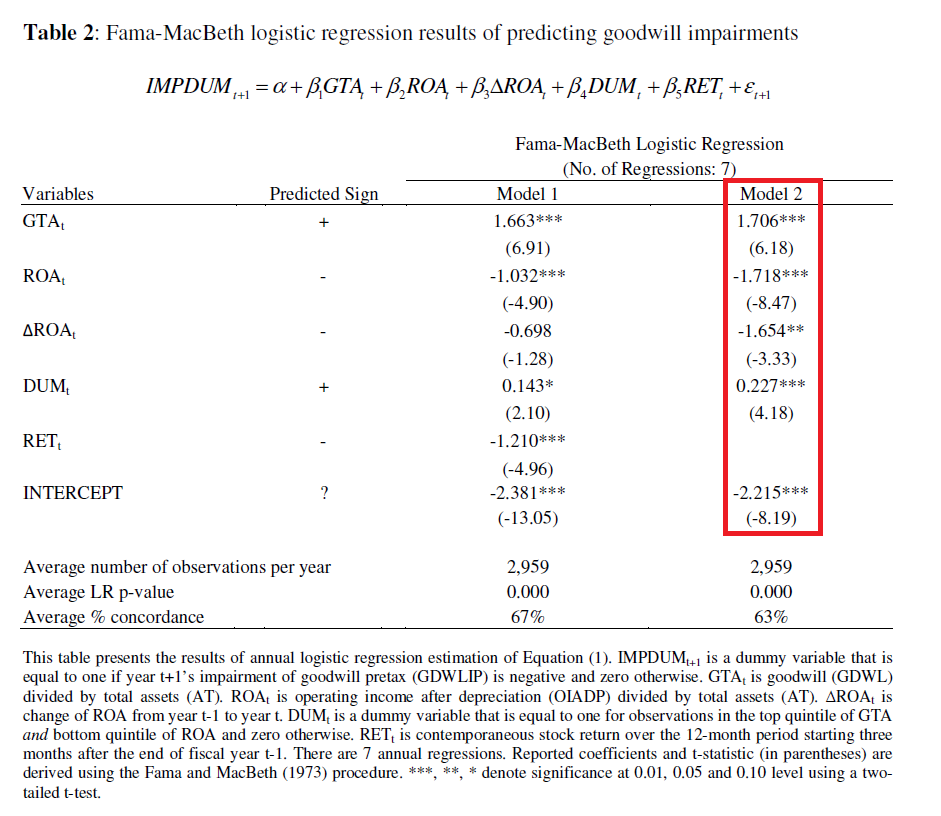
The authors first estimate a model that can be used to predict whether or not goodwill will be impaired. They find four variables (based on their previous tests) that are associated with goodwill impairment. The variables are total goodwill scaled by total assets (GTA), return on assets (ROA), change in return on assets (Change ROA), and a dummy variable equal to 1 if the firm is in the highest quintile of GTA and lowest quintile of ROA (lots of goodwill, no profitability).
The results are hypothetical results and are NOT an indicator of future results and do NOT represent returns that any investor actually attained. Indexes are unmanaged, do not reflect management or trading fees, and one cannot invest directly in an index. Additional information regarding the construction of these results is available upon request.
The authors then put together a relatively complicated strategy called IPROB, which uses the estimated coefficients from the IMPDUM model above to predict future goodwill impairments.
Let’s keep it simple, stupid. Shoot. Move. Communicate.
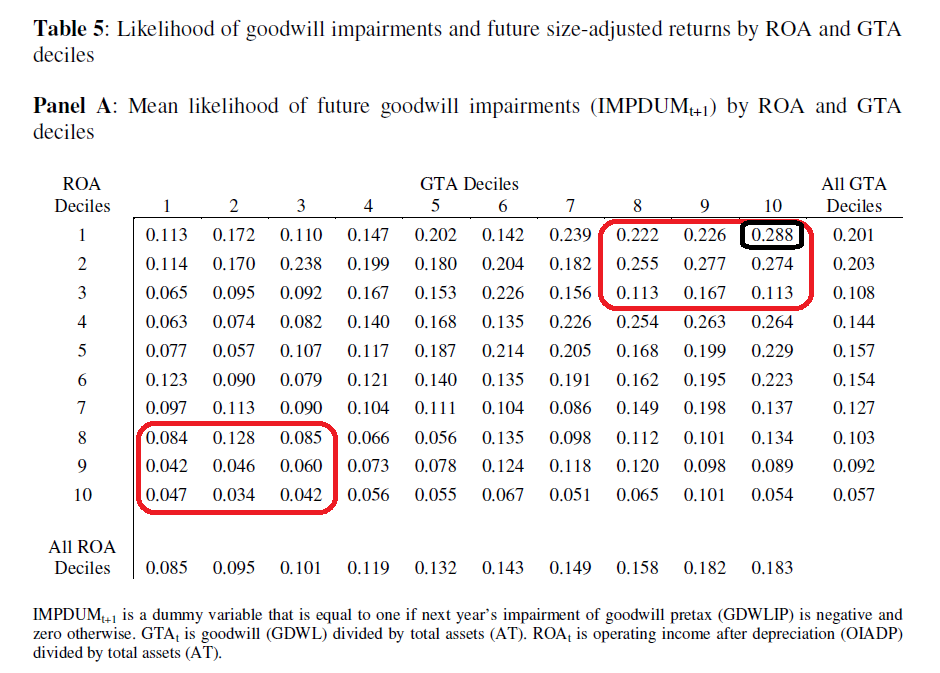
Instead of calibrating model coefficients and trying to create an IPROB, how about we focus on two simple measures–GTA and ROA. The authors do just that and show us the trading strategy performance. Table 5 verifies that the combo of GTA and ROA actually predict future impairment. For example, ROA/GTA(1,10) shows a 28.8% probability of impairment.
The results are hypothetical results and are NOT an indicator of future results and do NOT represent returns that any investor actually attained. Indexes are unmanaged, do not reflect management or trading fees, and one cannot invest directly in an index. Additional information regarding the construction of these results is available upon request.
Now on to the returns:
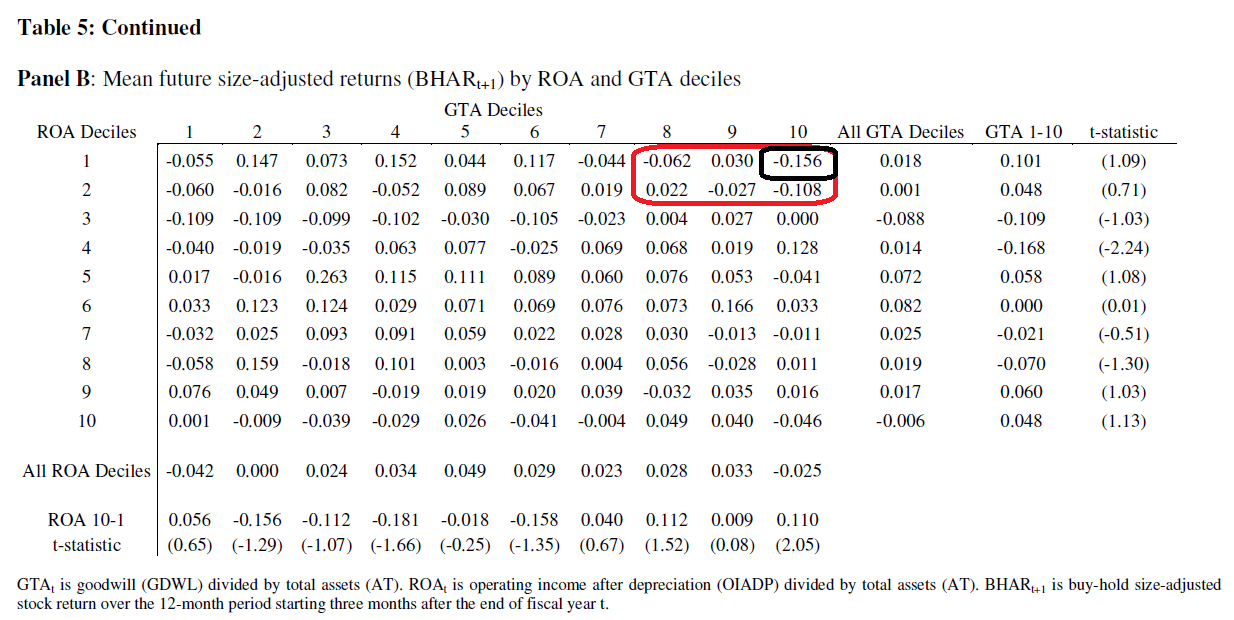
The results are hypothetical results and are NOT an indicator of future results and do NOT represent returns that any investor actually attained. Indexes are unmanaged, do not reflect management or trading fees, and one cannot invest directly in an index. Additional information regarding the construction of these results is available upon request.
Looks like the combination of low profitability and high goodwill lead to crappy returns via the future goodwill impairment channel: -15.6% to be exact! Managers simply do not want to release bad news until they absolutely must!
Investment Strategy:
- Identify firms that are in the highest GTA and lowest ROA deciles.
- Short these firms, because there is likely going to be a goodwill impairment announcement that will be unanticipated by the market.
- Hedge with a size-adjusted benchmark (e.g., Russell 2000 etf) of long-side alpha strategy.
- Make money.
Commentary:
Having read 3 or 4 perturbations of this paper, I can tell you that the results have shifted around quite a bit–originally, the High GTA, low ROA, hit a -23% mark, and now it is banging out -15.6%. So one definitely has to think about robustness when interpreting these results. That said, -23%, or -15.6% are still profound numbers that cannot be ignored. We’ll be churning the data on this strategy and posting it to our data site in the near future–stay tuned.
About the Author: Wesley Gray, PhD
—
Important Disclosures
For informational and educational purposes only and should not be construed as specific investment, accounting, legal, or tax advice. Certain information is deemed to be reliable, but its accuracy and completeness cannot be guaranteed. Third party information may become outdated or otherwise superseded without notice. Neither the Securities and Exchange Commission (SEC) nor any other federal or state agency has approved, determined the accuracy, or confirmed the adequacy of this article.
The views and opinions expressed herein are those of the author and do not necessarily reflect the views of Alpha Architect, its affiliates or its employees. Our full disclosures are available here. Definitions of common statistics used in our analysis are available here (towards the bottom).
Join thousands of other readers and subscribe to our blog.


