We’ve been toying with models that will predict the stock market: better known as “cold fusion.”
There is an incredible amount of research on the subject and nobody seems to be convinced one way or the other that the market returns are predictable (for example, see Goyal and Welch 2008). Regardless, there are two simple prediction systems which seem to have “legs”: Faber’s moving average trading strategy and trading based on the current div. yield.
Moving Average Systems
Faber’s strategy is straight forward: If the S&P 500 is above your MA rule, hold, else, invest in cash or bonds.
In this quick research piece we invest in the S&P 500 if the price if the 2 month moving average is above the 10-month moving average, and invest in long-govt bonds (10 years) otherwise (ma (2,10) in the graphs).
Dividend Yield System
The dividend strategy is less straight forward, unless you are familiar with “predictive regressions.” (see an old post we have on the Shiller P/E, which is the same sort of analysis )
Basically, you run a regression of dividend yield (independent variable) against future returns (dependent variable) and estimate the historical relationship between div yield and future returns. Once you have the relationship established, you plug the current dividend yield into your estimated model and spit out a ‘predicted’ market return. If the prediction is good, invest in S&P 500, if the prediction is bad, invest in long-govt bonds. We use a basic utility model to determine how much to allocate to stocks vs bonds (allocation= 1/5*(predicted return/past 5-year variance of returns)).
If the “utility model” flew past your head, just understand the basic concept–when predicted returns are good, invest in market, when they are bad, invest in bonds, and when they are in the middle, spread your bet between the stock market and bonds.
Some Results:
I analyse the following strats:
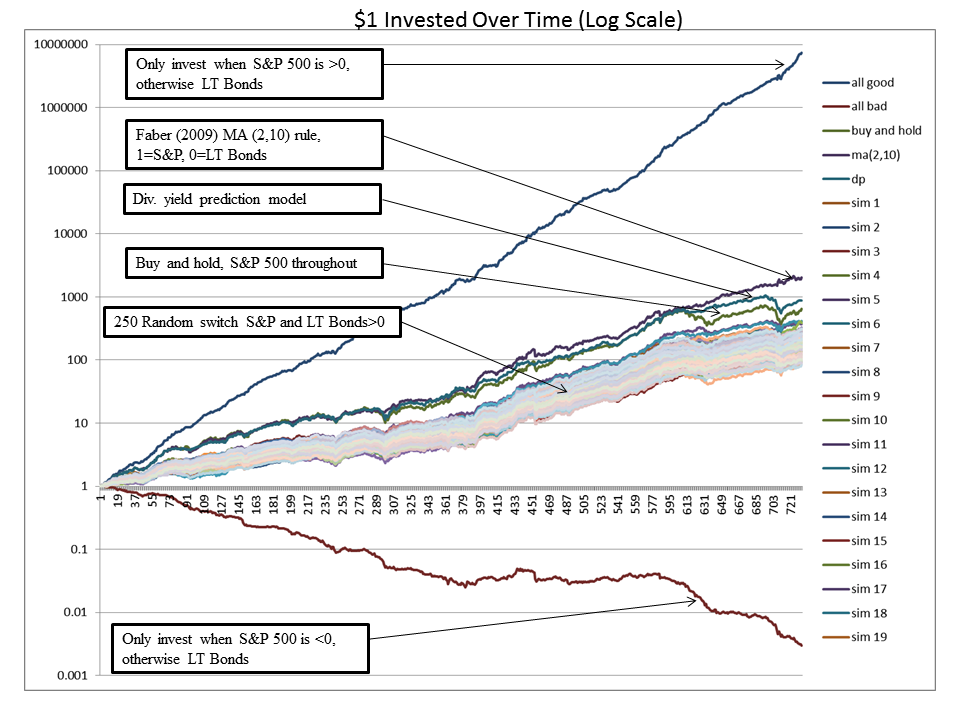
- A “perfect” system that invests in the S&P 500 when the return is >0 and invests in long bonds, otherwise.
- A “perfectly bad” system that invests in the S&P 500 when the return is <0 and invests in long bonds, otherwise.
- 250 random simulations that alternate their allocations to stocks and bonds each month in a completely random fashion.
- A MA (2,10) allocation system that invests in the S&P when the 2-month MA is above the 10-month MA, and invests in bonds, otherwise.
- A dividend yield allocation system that invests in the S&P when predicted returns are good, and invests in bonds when predicted returns are bad.
First, let’s look at the outright performance.
- The perfect systems works real well and the perfectly bad system works real poorly–duh.
- The 250 random stock/bond portfolios sit in a decent range, which suggests that your investment advisors’ allocation advice on when to shift to bonds or equity is probably no different than a random number generator.
- Buy-and-hold (red line) does okay.
- The MA (2,10) and the div-yield stock/bond allocator systems outperform buy-and-hold by a decent margin.
The results are hypothetical results and are NOT an indicator of future results and do NOT represent returns that any investor actually attained. Indexes are unmanaged, do not reflect management or trading fees, and one cannot invest directly in an index. Additional information regarding the construction of these results is available upon request.
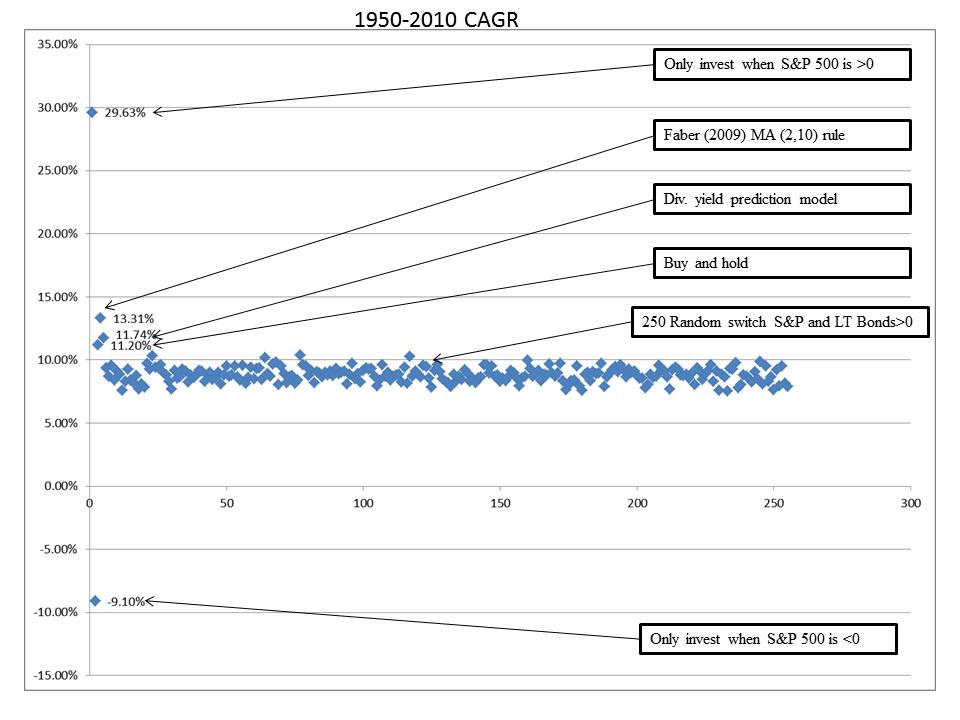
Here is another way of looking at performance: compound annual growth rate (CAGR).
- Same story as above: Perfect>MA>div>buy-and-hold>random>perfectly bad
The results are hypothetical results and are NOT an indicator of future results and do NOT represent returns that any investor actually attained. Indexes are unmanaged, do not reflect management or trading fees, and one cannot invest directly in an index. Additional information regarding the construction of these results is available upon request.
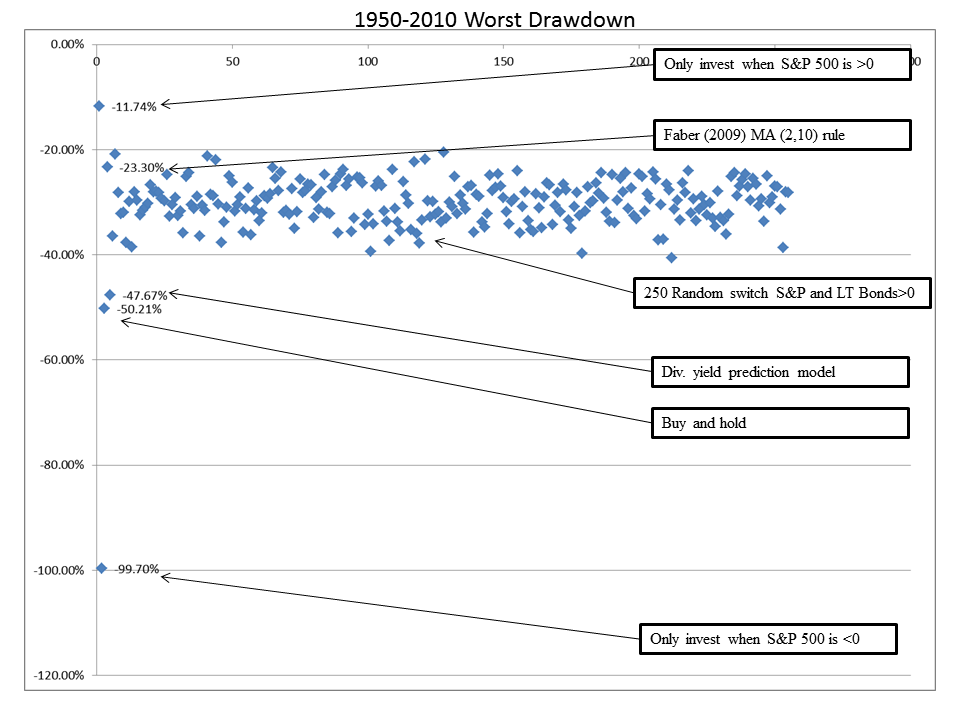
But life is not only about returns, it is also bout risk. In this figure we look at worst drawdown.
- The perfect system suffers a small drawdown because the system sometimes invest in long-bonds, which are not guarenteed to go up in value.
- The random stock/bond portfolios have drawdowns in the 20-30% range, which is about what you’d expect for a portfolio that is on average 50% stock, 50% bond.
- The buy-and-hold drawdown is pretty insane: -50.21%!
- The div drawdown is not far behind at -47.67%
- And the MA rule sits on the top range of the random portfolios at -23.30%
The results are hypothetical results and are NOT an indicator of future results and do NOT represent returns that any investor actually attained. Indexes are unmanaged, do not reflect management or trading fees, and one cannot invest directly in an index. Additional information regarding the construction of these results is available upon request.
Conclusion
Buy and hold? Really? Simple allocation timing models have beat buy-and-hold and have had less risk. Of course, one response is that the allocation rules were just “lucky”. Well, why do the allocation rules also beat the 250 random stock/bond allocation models? They may be lucky, but in an opaque world where nothing is certain and we can never get enough evidence to really ‘prove’ anything, what is an investor to do?
My advice: think about strategic allocation models and integrate them into your investment process.
And for those of you who think strategic timing is against the value investor creed, simply look at Warren Buffett–he is the ultimate strategic timer. Analyzing his portfolio over time suggests that he tends to horde cash during extreme high valuation markets and invest cash at extremely low valuation markets–that my friends, is strategic timing by the greatest value investor of all time.

About the Author: Wesley Gray, PhD
—
Important Disclosures
For informational and educational purposes only and should not be construed as specific investment, accounting, legal, or tax advice. Certain information is deemed to be reliable, but its accuracy and completeness cannot be guaranteed. Third party information may become outdated or otherwise superseded without notice. Neither the Securities and Exchange Commission (SEC) nor any other federal or state agency has approved, determined the accuracy, or confirmed the adequacy of this article.
The views and opinions expressed herein are those of the author and do not necessarily reflect the views of Alpha Architect, its affiliates or its employees. Our full disclosures are available here. Definitions of common statistics used in our analysis are available here (towards the bottom).
Join thousands of other readers and subscribe to our blog.