Last week we discussed the possibility that “momentum is finished.“
Astute readers of the blog generally agreed with the concept, but also pointed out that risk management techniques can potentially save momentum strategies.
Other observers–to include a Wharton finance professor who has more brains than all of us combined–highlighted recent work by Kent Daniel:
Kent’s paper:
http://papers.ssrn.com/sol3/papers.cfm?abstract_id=1914673
Kent’s slides:
http://www.cap.columbia.edu/pdf-files/Daniel_K_CAP_2010.pdf
I decided to conduct some back of the envelope tests for some of these claims: 1) risk management techniques can save momentum, and 2) Momentum suffers from “predictable crashes.”
Conclusion: Maybe momentum isn’t dead.
First question: Do risk management techniques help save momentum?
To conduct these tests I created two portfolios:
1) A monthly rebalanced portfolio that goes long the highest momentum stocks and short the lowest momentum stocks (note, these are decile portfolios. This strategy is not the size/bm adjusted momentum portolios on French’s website)
2) The portfolio in 1), but I apply a simple moving average timing rule that invests in the strategy if the 2 month moving average is above the 10 month moving average, and sits in cash otherwise. Symbolically, this is represented as MA(2,10). This classic idea has recently been brought to the forefront by Meb Faber over at http://www.mebanefaber.com/timing-model/.
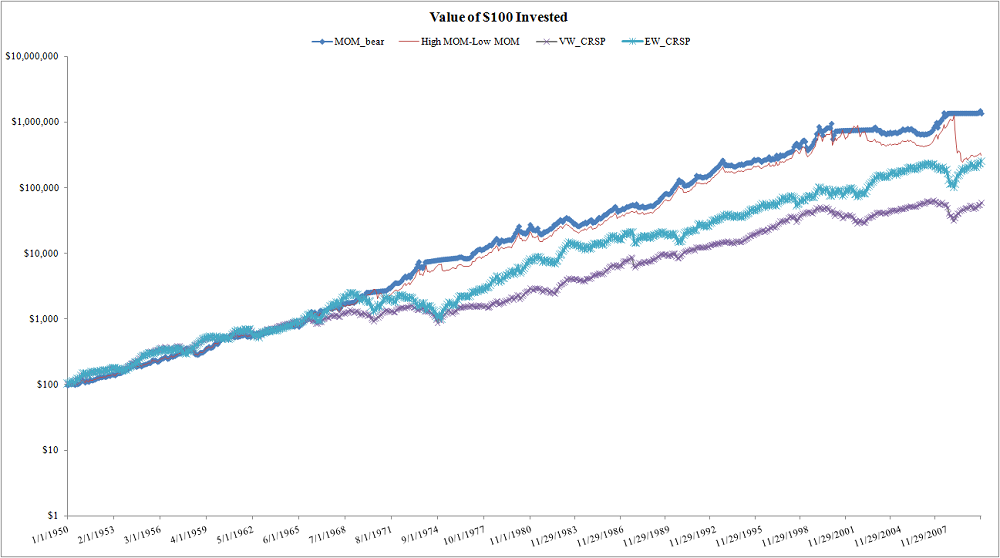
Results: equal-weight market, L/S mom, and risk-managed L/S all do about the same…but the risk profiles of each are entirely different!
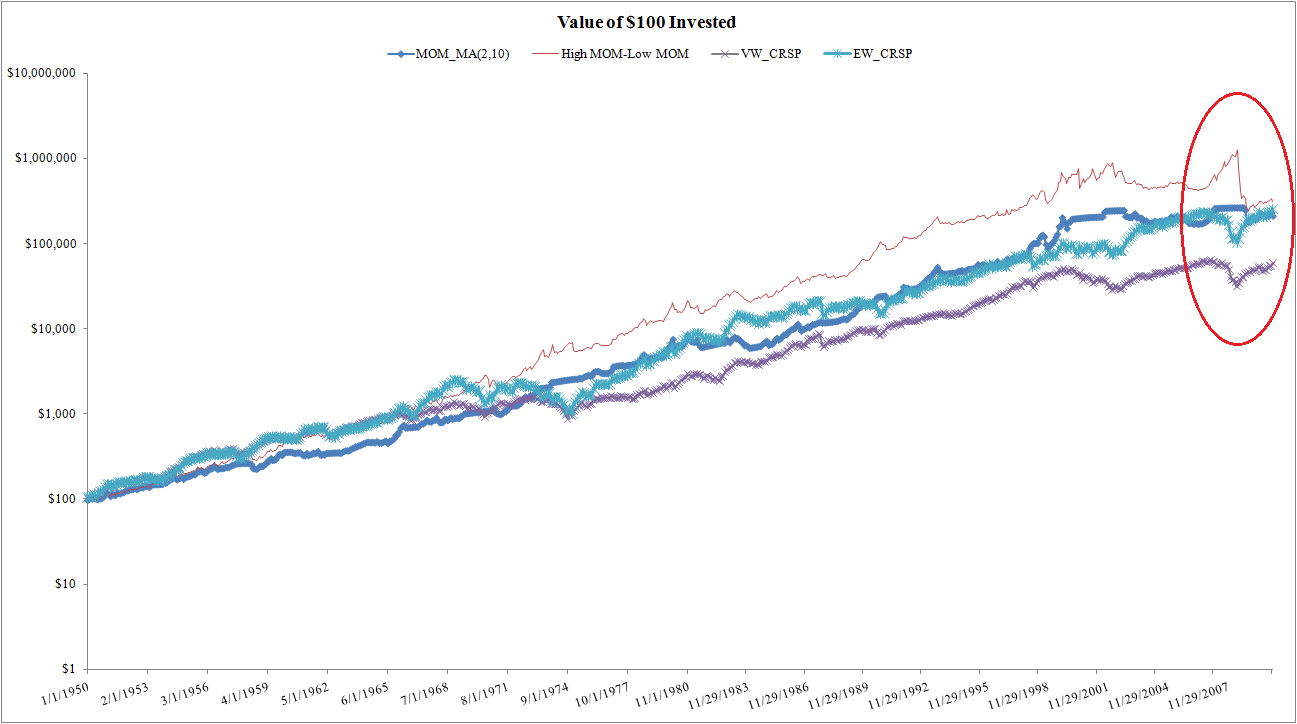
The results are hypothetical results and are NOT an indicator of future results and do NOT represent returns that any investor actually attained. Indexes are unmanaged, do not reflect management or trading fees, and one cannot invest directly in an index. Additional information regarding the construction of these results is available upon request.
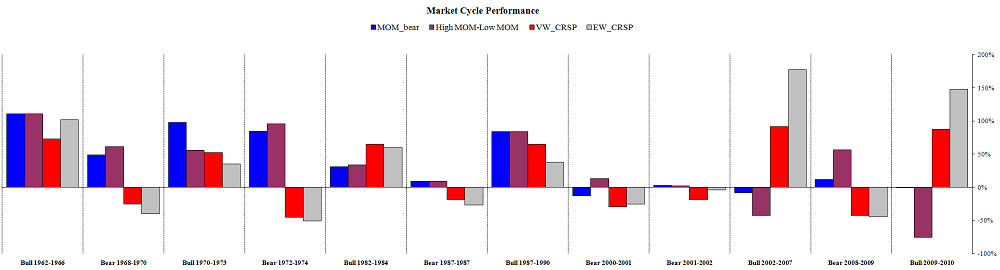
Next, we look at various bull/bear cycles. The striking difference comes in the latest bull market rally, where momentum gets crushed. The MA rule saves you (as it does in the 30’s crashes).
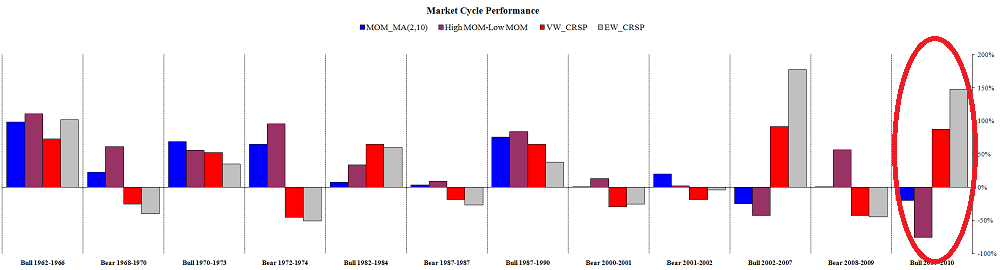
The results are hypothetical results and are NOT an indicator of future results and do NOT represent returns that any investor actually attained. Indexes are unmanaged, do not reflect management or trading fees, and one cannot invest directly in an index. Additional information regarding the construction of these results is available upon request.
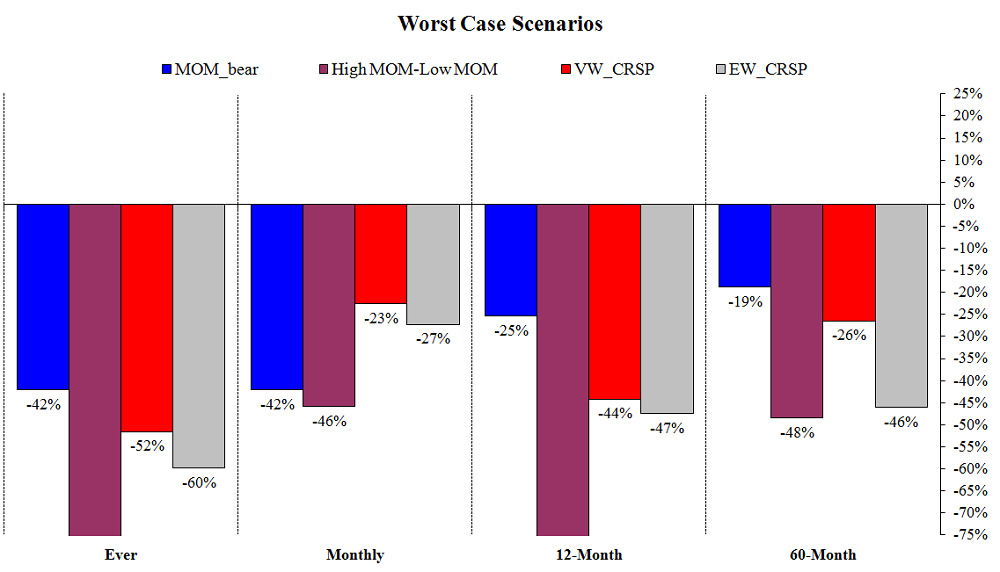
The drawdown analysis is another way of pointing out that risk-managed momentum certainly seems superior to regular momentum.
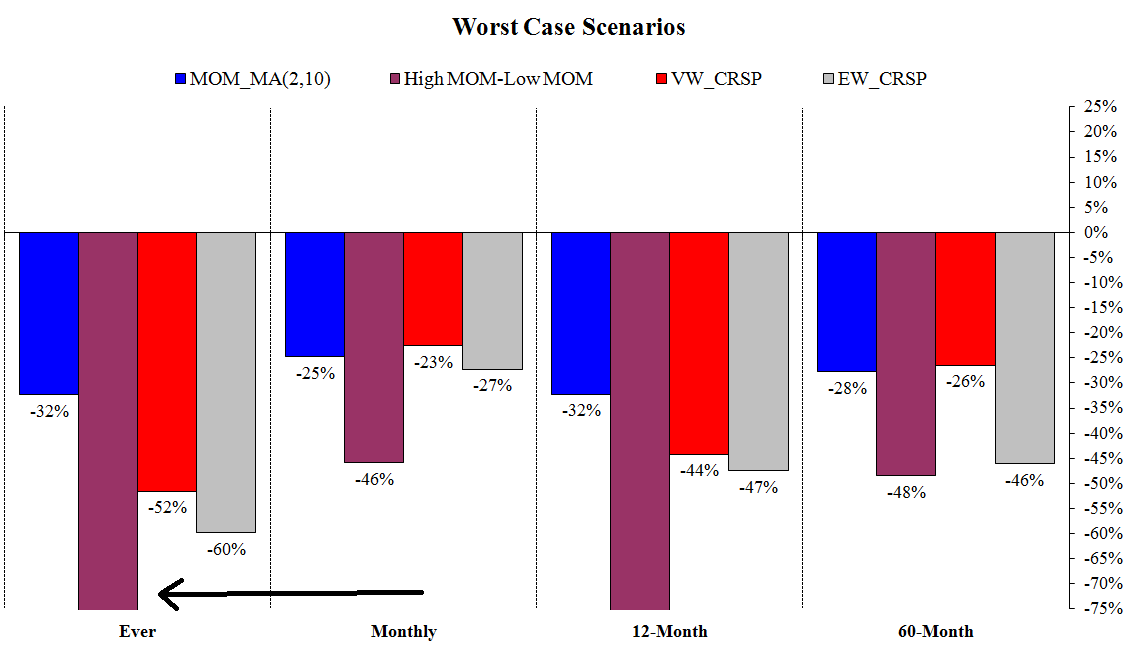
The results are hypothetical results and are NOT an indicator of future results and do NOT represent returns that any investor actually attained. Indexes are unmanaged, do not reflect management or trading fees, and one cannot invest directly in an index. Additional information regarding the construction of these results is available upon request.
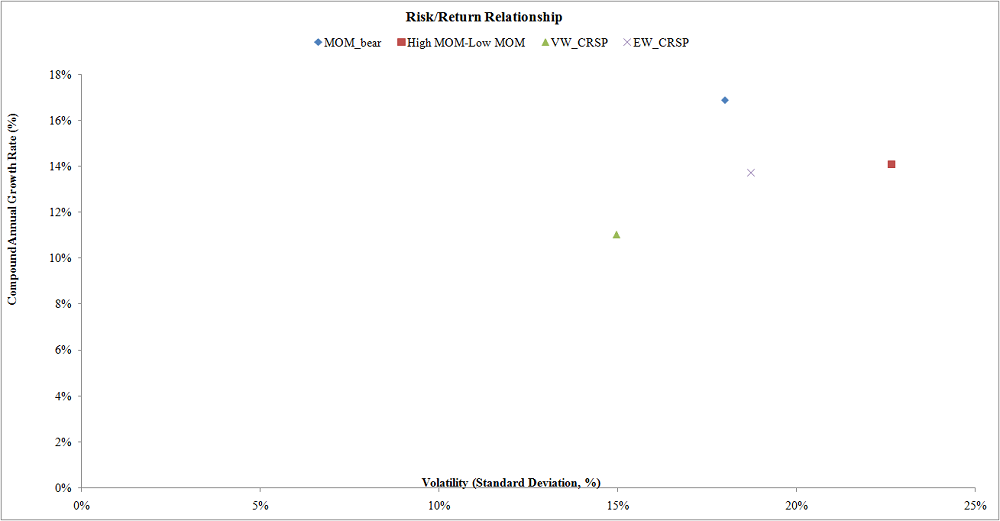
And our favorite MBA 101 chart. The chart shows a definite trade-off for small-caps and large caps (as captured by equal weight vs. value weight). However, the chart doesn’t show a sensible tradeoff for the straight L/S momentum strategy and the risk-managed L/S momentum strategy–the risk-managed version has similar return, but much less standard deviation.

The results are hypothetical results and are NOT an indicator of future results and do NOT represent returns that any investor actually attained. Indexes are unmanaged, do not reflect management or trading fees, and one cannot invest directly in an index. Additional information regarding the construction of these results is available upon request.
If you’d like to dig in to the year by year returns of the various strategies, here is your opportunity:
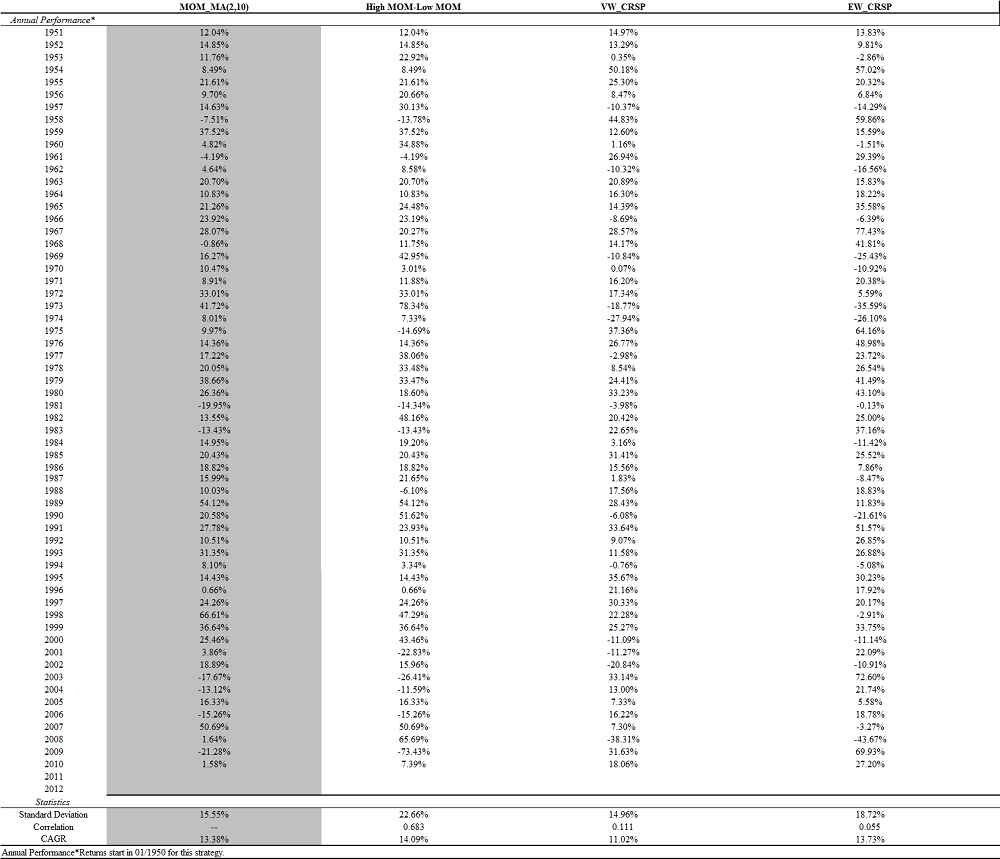
The results are hypothetical results and are NOT an indicator of future results and do NOT represent returns that any investor actually attained. Indexes are unmanaged, do not reflect management or trading fees, and one cannot invest directly in an index. Additional information regarding the construction of these results is available upon request.
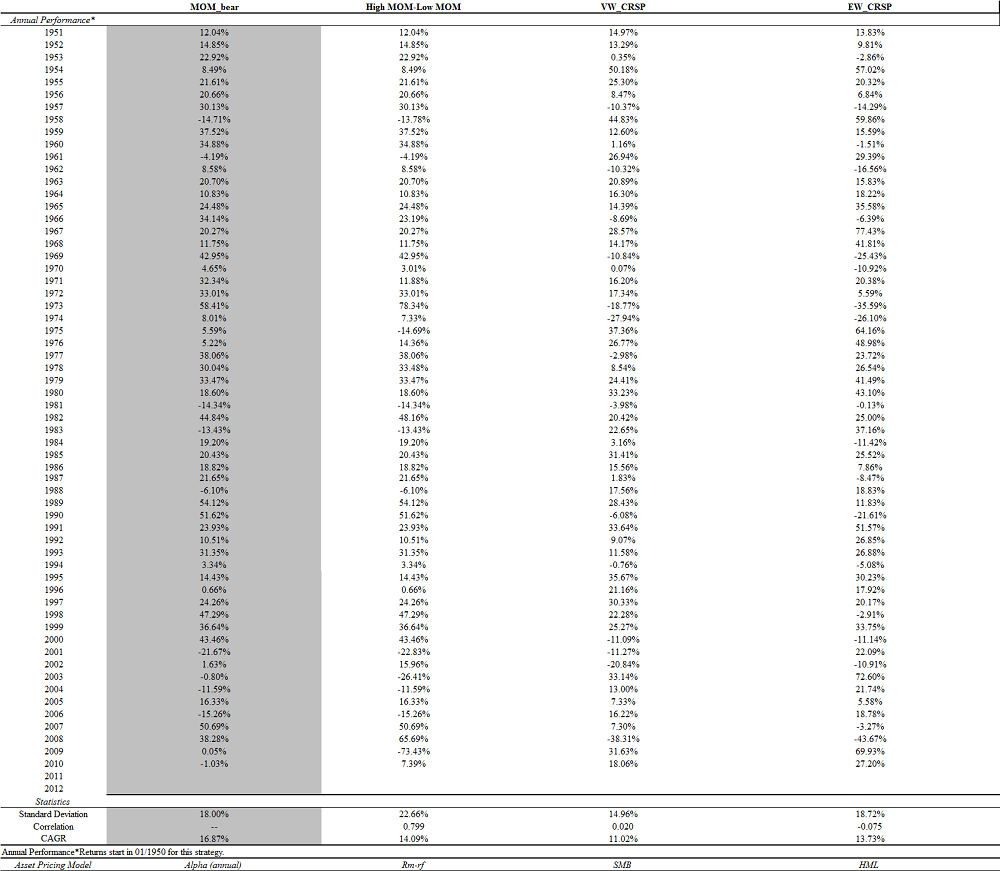
Second question: Can we use ‘predictable crashes’ to save momentum?
A key insight from Kent’s analysis (as well as others who have studied momentum) is that momentum gets destroyed following major market blow outs. Two prime examples of momentum failing are in the sporadic bull markets of the Great Depression and during the March 2009 bull market rally of our current Great Depression (v 2.0).
I developed a simple rule that attempts to save momentum from blowing up. I create a ‘bear market indicator’, which is equal to 0 if the past 24-month return on the market is positive, and equal to 1 if the past 24-month return on the market is less than zero. The trading strategy invests in l/s momentum when there is no bear market signal (recent market performance has been above 0%), and sits in cash when we have been in a recent bear market (recent performance sucked). Simple enough. Now how does it perform?
Looks good for the bear market indicator risk management technique
The results are hypothetical results and are NOT an indicator of future results and do NOT represent returns that any investor actually attained. Indexes are unmanaged, do not reflect management or trading fees, and one cannot invest directly in an index. Additional information regarding the construction of these results is available upon request.
Still looking good…
The results are hypothetical results and are NOT an indicator of future results and do NOT represent returns that any investor actually attained. Indexes are unmanaged, do not reflect management or trading fees, and one cannot invest directly in an index. Additional information regarding the construction of these results is available upon request.
The drawdowns using the bear market indicator are rough, but better than the straight-up L/S momentum…
The results are hypothetical results and are NOT an indicator of future results and do NOT represent returns that any investor actually attained. Indexes are unmanaged, do not reflect management or trading fees, and one cannot invest directly in an index. Additional information regarding the construction of these results is available upon request.
And our favorite MBA 101 chart again. The bear market indicator does very well!
The results are hypothetical results and are NOT an indicator of future results and do NOT represent returns that any investor actually attained. Indexes are unmanaged, do not reflect management or trading fees, and one cannot invest directly in an index. Additional information regarding the construction of these results is available upon request.
Here are the detailed year by year returns–not bad at all.
The results are hypothetical results and are NOT an indicator of future results and do NOT represent returns that any investor actually attained. Indexes are unmanaged, do not reflect management or trading fees, and one cannot invest directly in an index. Additional information regarding the construction of these results is available upon request.
Caveats:
These indicators are completely data-mined by previous researchers and may not have any predictive value in the future. But you know what? Is the risk of being in a data-mined trading rule higher than staying long and strong in the rough and tumble buy-and-hold mantra?
Another caveat: I’ll admit it, I was brainwashed to believe that technical rules can’t work because Warren Buffett, Ben Graham, and a whole slew of academics have sworn off technical analysis as the enemy of the world–I still might believe them. Nonetheless, the more I dig into the results from using simple technical analysis rules, the more I realize I need to think outside the box more often. Even if the rules don’t add “alpha”, they do help manage risk–especially the rip-your-face-off drawdowns of 50%+.
Happy investing.
Disclosure:
Performance figures contained herein are hypothetical, unaudited and prepared by Alpha Architect, LLC; hypothetical results are intended for illustrative purposes only.
Past performance is not indicative of future results, which may vary.
There is a risk of substantial loss associated with trading commodities, futures, options and other financial instruments. Before trading, investors should carefully consider their financial position and risk tolerance to determine if the proposed trading style is appropriate. Investors should realize that when trading futures, commodities and/or granting/writing options one could lose the full balance of their account. It is also possible to lose more than the initial deposit when trading futures and/or granting/writing options. All funds committed to such a trading strategy should be purely risk capital.
Hypothetical performance results (e.g., quantitative backtests) have many inherent limitations, some of which, but not all, are described herein. No representation is being made that any fund or account will or is likely to achieve profits or losses similar to those shown herein. In fact, there are frequently sharp differences between hypothetical performance results and the actual results subsequently realized by any particular trading program. One of the limitations of hypothetical performance results is that they are generally prepared with the benefit of hindsight. In addition, hypothetical trading does not involve financial risk, and no hypothetical trading record can completely account for the impact of financial risk in actual trading. For example, the ability to withstand losses or adhere to a particular trading program in spite of trading losses are material points which can adversely affect actual trading results. The hypothetical performance results contained herein represent the application of the quantitative models as currently in effect on the date first written above and there can be no assurance that the models will remain the same in the future or that an application of the current models in the future will produce similar results because the relevant market and economic conditions that prevailed during the hypothetical performance period will not necessarily recur. There are numerous other factors related to the markets in general or to the implementation of any specific trading program which cannot be fully accounted for in the preparation of hypothetical performance results, all of which can adversely affect actual trading results. Hypothetical performance results are presented for illustrative purposes only.
Indexes are unmanaged, do not reflect management or trading fees, and one cannot invest directly in an index.
There is no guarantee, express or implied, that long-term return and/or volatility targets will be achieved. Realized returns and/or volatility may come in higher or lower than expected.

About the Author: Wesley Gray, PhD
—
Important Disclosures
For informational and educational purposes only and should not be construed as specific investment, accounting, legal, or tax advice. Certain information is deemed to be reliable, but its accuracy and completeness cannot be guaranteed. Third party information may become outdated or otherwise superseded without notice. Neither the Securities and Exchange Commission (SEC) nor any other federal or state agency has approved, determined the accuracy, or confirmed the adequacy of this article.
The views and opinions expressed herein are those of the author and do not necessarily reflect the views of Alpha Architect, its affiliates or its employees. Our full disclosures are available here. Definitions of common statistics used in our analysis are available here (towards the bottom).
Join thousands of other readers and subscribe to our blog.