First, you gotta read Warren Buffett’s classic piece from 1999:
http://money.cnn.com/magazines/fortune/fortune_archive/1999/11/22/269071/
Buffett highlights the inextricable tie between GDP growth and corporate profits. GDP growth is the limiting factor (interest rates and margins are the other factors).
And here is his follow up in 2001:
http://money.cnn.com/magazines/fortune/fortune_archive/2001/12/10/314691/
Recently, there have been a spat of articles related to macro valuation signals and the stock market. Many of these articles talk about “Buffet’s favorite valuation tool.”
An example:
Why is Market Cap / GNP considered Buffett’s favorite? He said so…
“…probably the best single measure of where valuations stand at any given moment.”
–Warren E. Buffett from 2001 Fortune article
Gurufocus has a great article on the topic and some associated tools:
http://www.gurufocus.com/stock-market-valuations.php
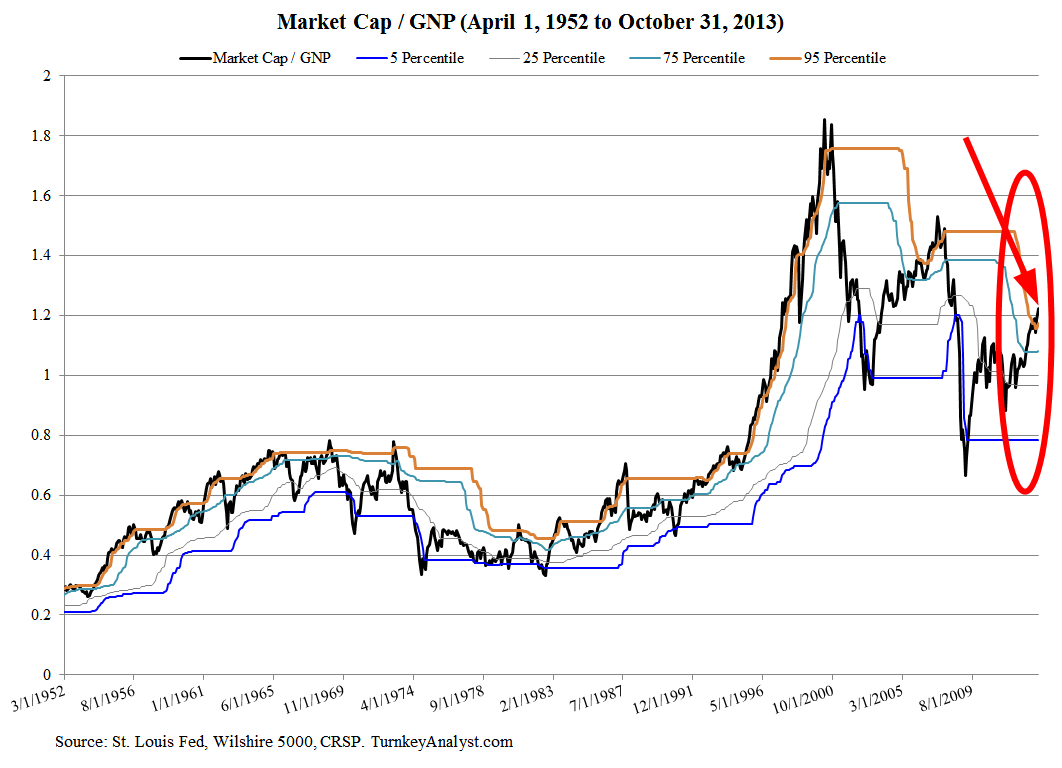
Below is a chart of the Market Cap to GNP ratio since 1952 along with associated 5-year rolling percentile bands to indicate times of “excess.”
We are able to extend the ratio past the Wilshire 5000 data via CRSP, and you can also recreate a proxy via market-cap breakpoint data from Ken French’s
website: http://mba.tuck.dartmouth.edu/pages/faculty/ken.french/data_library.html.
Data on GNP/GDP only goes back to 1947 so we can’t do better than that.
Currently, the ratio stands at 1.224x.
[Click to Enlarge] The results are hypothetical results and are NOT an indicator of future results and do NOT represent returns that any investor actually attained. Indexes are unmanaged, do not reflect management or trading fees, and one cannot invest directly in an index. Additional information regarding the construction of these results is available upon request.
The results are hypothetical results and are NOT an indicator of future results and do NOT represent returns that any investor actually attained. Indexes are unmanaged, do not reflect management or trading fees, and one cannot invest directly in an index. Additional information regarding the construction of these results is available upon request.
Key takeaways?
- Expensive, but not unprecedented.
- Broke the rolling 5-year 95 percentile breakpoint.
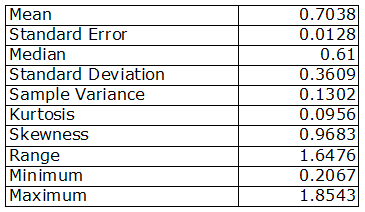
- Mean reversion to long-term mean of .70 would imply SERIOUS market drawdowns.
But what are the alternatives? 2.5% 10-year treasuries?

About the Author: Wesley Gray, PhD
—
Important Disclosures
For informational and educational purposes only and should not be construed as specific investment, accounting, legal, or tax advice. Certain information is deemed to be reliable, but its accuracy and completeness cannot be guaranteed. Third party information may become outdated or otherwise superseded without notice. Neither the Securities and Exchange Commission (SEC) nor any other federal or state agency has approved, determined the accuracy, or confirmed the adequacy of this article.
The views and opinions expressed herein are those of the author and do not necessarily reflect the views of Alpha Architect, its affiliates or its employees. Our full disclosures are available here. Definitions of common statistics used in our analysis are available here (towards the bottom).
Join thousands of other readers and subscribe to our blog.