Recency Bias and Post-Earnings Announcement Drift
- Qingzhong Ma, David Whidbee, and Wei Zhang
- A version of the paper can be found here.
- Want a summary of academic papers with alpha? Check out our Academic Research Recap Category.
Abstract:
In this paper we examine the role of the timing of 52-week high, or recency, in the post earnings announcement drift (PEAD) puzzle. We argue that, because investors are less likely to bid up (down) a stock price if a stock’s 52-week high occurred in the recent (distant) past, these stocks are underpriced (overpriced) and earn higher (lower) future returns. We report these findings. First, PEAD profits are mainly driven by recency bias. An enhanced strategy based on both PEAD and recency accounts for 74% of total PEAD profits. Second, the recency bias accounts for the entire PEAD profits of large stocks and of the recent 24 years. The effect of recency bias on PEAD exists even after controlling for price proximity to 52-week high. Our evidence suggests that recency bias plays an important role in PEAD.
Alpha Highlight:
Murdock (1962) finds that in an experiment in which subjects are presented a list of words whose orders are irrelevant, subjects tend to recall words at the end of the list.
More generally, when given a series of items in a random order, people tend to recall those best listed at the last. It is called recency effect. Some researchers attribute this bias to human’s short-term memory, availability bias, limited attention and so on.
This paper studies how recency bias (based on the 52-week high) can affect investors’ valuation perceptions by examining its role in the post-earnings announcement drift (PEAD).
Let’s first take a look at two key concepts:
- Post-earning Announcement Drift (PEAD): stock price of firms with positive (negative) earnings surprise in the recent quarter tend to drift upward (downward) in the subsequent quarters.
- 52-week high: refers to the highest price traded during the past 1 year period. It is a simple but important technical indicator to investors since people tend to gauge whether to buy or sell based on this anchoring price.
- For example, when a stock is approaching its highest price over the past 1 year, people may not be willing to buy it but to sell it.
The paper assumes that stocks with their 52-week high prices occurring in the recent past (high recency ratio) tend to earn higher returns than those with their 52-week high prices occurring in the distant past (low recency ratio) in the subsequent 3 months.
The formula of Recency ratio (RR)
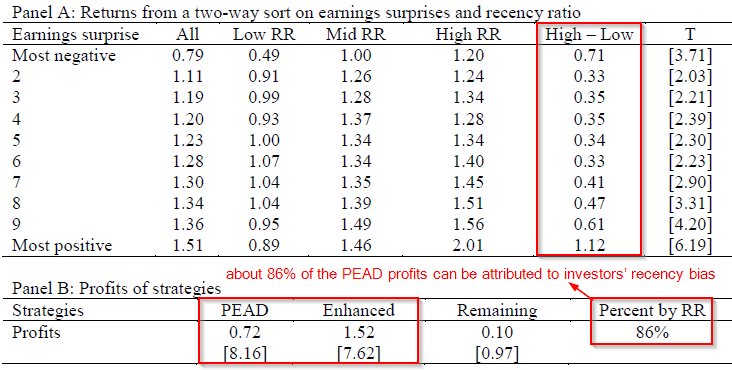
Next, the paper shed lights on what drives PEAD by examining the role of investors’ recency bias. They propose two strategies below:
- Simple PEAD strategy: simply buy stocks with earnings surprise in the top decile and sell stocks with earnings surprise in the bottom decile.
- Enhanced strategy: further rank stocks into terciles of recency ratio. Buy stocks with the most positive earnings surprise (top decile) and high recency ratio (top 1/3) and sell stocks with the most negative earnings surprise (bottom decile) and low recency ratio (bottom 1/3).
By comparing the performances of the Enhanced strategy against the simple PEAD strategy, we can find out exactly how much of the PEAD returns can be attributed to investors’ recency bias.
Key findings:
- The profit from the enhanced strategy is more than double that of the simple PEAD strategy.
- About 86% of the PEAD profits can be attributed to investors’ recency bias.
The results are hypothetical results and are NOT an indicator of future results and do NOT represent returns that any investor actually attained. Indexes are unmanaged, do not reflect management or trading fees, and one cannot invest directly in an index. Additional information regarding the construction of these results is available upon request.

About the Author: Wesley Gray, PhD
—
Important Disclosures
For informational and educational purposes only and should not be construed as specific investment, accounting, legal, or tax advice. Certain information is deemed to be reliable, but its accuracy and completeness cannot be guaranteed. Third party information may become outdated or otherwise superseded without notice. Neither the Securities and Exchange Commission (SEC) nor any other federal or state agency has approved, determined the accuracy, or confirmed the adequacy of this article.
The views and opinions expressed herein are those of the author and do not necessarily reflect the views of Alpha Architect, its affiliates or its employees. Our full disclosures are available here. Definitions of common statistics used in our analysis are available here (towards the bottom).
Join thousands of other readers and subscribe to our blog.