Analyzing Valuation Measures: A Performance Horse-Race Over the Past 40 Years
- Gray and Vogel
- A version of the paper can be found here and here.
- Want a summary of academic papers with alpha? Check out our Academic Research Recap Category.
Core Idea:
Paper asks a simple question: “Which valuation metric has historically performed the best?” Who are the participants in this horse-race?
- Earnings to Market Capitalization (E/M).
- EBITDA to Total Enterprise Value (EBITDA/TEV).
- Free Cash Flow to Total Enterprise Value (FCF/TEV).
- Gross-Profits to Total Enterprise Value (GP/TEV).
- Book Value of Equity to Market Capitalization (B/M)
For clarification, Total Enterprise Value (TEV) is defined as:
- TEV = Market Capitalization + Debt + Preferred Stock Value – Cash and Short-term Investments.
While investors rely on a wide range of metrics for establishing a firm’s value, there isn’t much research devoted to comparing how effective such metrics have performed over time. Are all valuation metrics created equal? Or are there reasons to prefer one over another? Indeed, Eugene Fama and Ken French went so far as to claim, “…the average returns spreads produced by different [valuation] ratios are similar…and, in statistical terms, [are] indistinguishable from one another.” This is a pretty sweeping claim, and as such, deserves closer scrutiny. Does this claim stand up to empirical scrutiny? The paper finds evidence that this claim is not necessarily true, and that there are reasons to believe all valuation metrics are not, after all, created equal.
Results:
The results are hypothetical results and are NOT an indicator of future results and do NOT represent returns that any investor actually attained. Indexes are unmanaged, do not reflect management or trading fees, and one cannot invest directly in an index. Additional information regarding the construction of these results is available upon request.
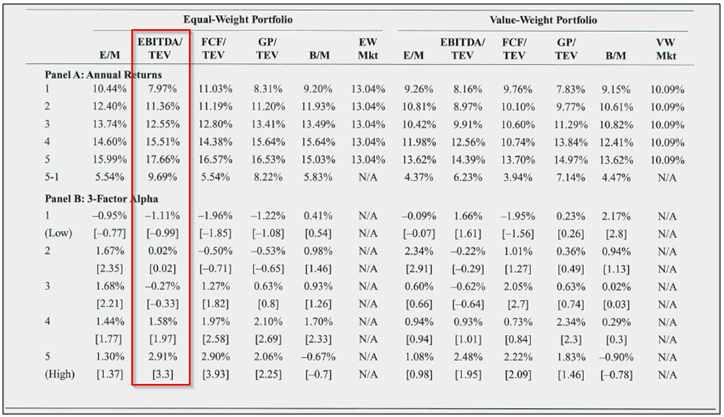
The evidence suggests that EBITDA/TEV has outperformed other valuation metrics tested (E/M, FCF/TEV, GP/TEV, B/M) during the period of 1971 to 2010. Examining the equal-weight portfolios, this measure generates the largest spread between value and growth stocks, and generates the largest 3-factor alpha for the value stock portfolio.
More Evidence:
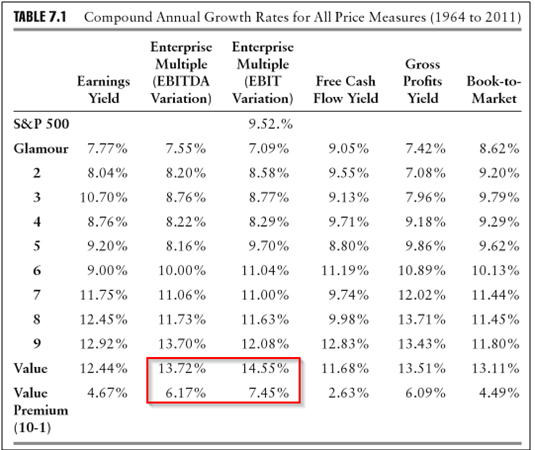
Gray and Carlisle (2012) did a comprehensive comparisons of various value metrics in their book – Quantitative Value. The results in the book are consistent with Gray and Vogel (2012).
- The value portfolios created from the EBIT/TEV generates a CAGR of 14.55% over 1964 to 2011. The closest competitor is EBITDA/TEV at 13.72%. These two metrics also generate the biggest value premia.
The results are hypothetical results and are NOT an indicator of future results and do NOT represent returns that any investor actually attained. Indexes are unmanaged, do not reflect management or trading fees, and one cannot invest directly in an index. Additional information regarding the construction of these results is available upon request.
So next time someone says to you, “Hey, when evaluating a stock, you should really use the price/cash flow ratio, and and the price-to-book ratio,” the next question should be: “Really? Why?”

About the Author: Wesley Gray, PhD
—
Important Disclosures
For informational and educational purposes only and should not be construed as specific investment, accounting, legal, or tax advice. Certain information is deemed to be reliable, but its accuracy and completeness cannot be guaranteed. Third party information may become outdated or otherwise superseded without notice. Neither the Securities and Exchange Commission (SEC) nor any other federal or state agency has approved, determined the accuracy, or confirmed the adequacy of this article.
The views and opinions expressed herein are those of the author and do not necessarily reflect the views of Alpha Architect, its affiliates or its employees. Our full disclosures are available here. Definitions of common statistics used in our analysis are available here (towards the bottom).
Join thousands of other readers and subscribe to our blog.