Expected Skewness and Momentum
- Jacobs, Regele and Weber
- A version of the paper can be found here.
- Want a summary of academic papers with alpha? Check out our Academic Research Recap Category.
Abstract:
Motivated by the time-series insights of Daniel and Moskowitz (2014), we investigate the link between expected skewness and momentum in the cross-section. The three factor alpha of skewness-enhanced (-weakened) momentum strategies is about twice (half) as large as the traditional momentum alpha. In fact, skewness is among the most important cross-sectional determinants of momentum. Our findings do not neatly fit within a specific prominent theory of momentum. Due to the simplicity of the approach, its economic magnitude, and its existence among large stocks and in the recent past, the results appear difficult to reconcile with the efficient market hypothesis.
Alpha Highlight:
Daniel and Moskowitz (2014) and Barroso and Santa-Clara (2015) showed that the returns of momentum investing are negatively skewed. Specifically, the return distribution of momentum is largely concentrated on the right side with fat tails, i.e., momentum strategies yield positive returns but can also experience infrequent but significant negative returns. Thus, when pursuing high returns of momentum, investors are often reminded about the risks of momentum crashes.
Inspired by their work, this paper proposes skewness-enhanced momentum strategies, which double-sort stocks based on both skewness and past performance. The outcomes are eye-catching: the alpha of enhanced momentum strategies is about twice as large as traditional momentum (Jegadeesh and Titman, 1993) alpha.
The paper hypothesizes that the outperformance of winners is partly driven by negative skewness, and the underperformance of losers is partly driven by positive skewness. If you are not familiar with the concept of skewness, click here to learn more from Wikipedia.
Based on their conjectures, the authors come up with an enhanced long-short momentum strategy that focuses on negatively skewed winners and positively skewed losers. Below are the details:
- Step 1: Every month, first sort stocks into five equally sized portfolios based on the skewness measure of Bali et al (2011);
- Step 2: Within each quintile based on skewness, sort stocks into quintiles based on their past cumulative returns. In this paper, the authors choose a formation period of twelve months, a holding period of one month and skip one month in between (during which skewness is measured).
- Step 3: Long the stocks in the lowest skewness quintile (negative skew) and highest past performance; Short the stocks in the highest skewness quintile (positive skew) with the lowest past performance. Repeat this procedure every month.
Performance Highlights:
The paper examines results from 1927 to 2011. Below, Panel A of Table 1 shows the results to equal-weight portfolios. Enhanced momentum strategy yields an monthly 3-factor alpha of 2.55%, while the traditional momentum strategy (quintile 3 on skewness — winners minus losers) has a raw monthly 3-factor alpha of only 1.24%. Adding the skewness variable can double the alpha! The weakened momentum portfolio focus on positively skewed winners and negatively skewed losers. If the hypothesis is true that the momentum profits are driven by the negative skewness of winners and positive skewness of losers, then such premiums should be diminished after controlling for skewness. The results back the paper’s hypothesis: the monthly 3-factor alpha of weakened momentum is an insignificant 0.12%.
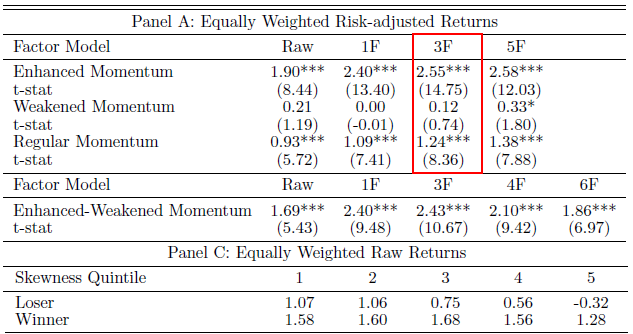
The results are hypothetical results and are NOT an indicator of future results and do NOT represent returns that any investor actually attained. Indexes are unmanaged, do not reflect management or trading fees, and one cannot invest directly in an index. Additional information regarding the construction of these results is available upon request.
Table 1, Panel C (show below) reports the equally-weighted raw returns of winners and losers in each skewness quintile. It shows no clear pattern for winners, but loser returns decline monotonically. The results show the skewness effect is mainly attributed to the short leg.
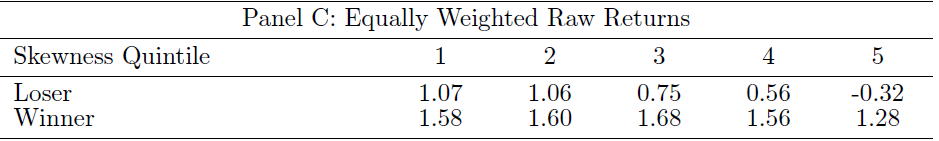
The results are hypothetical results and are NOT an indicator of future results and do NOT represent returns that any investor actually attained. Indexes are unmanaged, do not reflect management or trading fees, and one cannot invest directly in an index. Additional information regarding the construction of these results is available upon request.
Enhanced Momentum with Risk Management
Figure 1 below shows the invested growth of several strategies. First, one notices that the regular momentum strategy turns $1 into $29,706 from 1927-2011, a large increase from a simple market return B&H portfolio ($2,107). The enhanced momentum strategy turns a $1 investment in 1927 into$9,685,301 in 2011, which is more than 325-fold the traditional momentum strategy. However, the enhanced momentum has relatively higher volatility than the traditional momentum (as sown in the Table 3 below). To address this issue the authors apply risk management methods by Daniel and Moskowitz (2014) and Barroso and Santa-Clara (2015), which generate even better performances. These techniques are described below:
- Barroso and Santa-Clara (2015): scale the exposure of momentum to have constant risk/ target level of volatility over time. In their paper, the authors pick a target of an annualized volatility of 12%. This is labeled Enhanced Momentum*.
- Daniel and Moskowitz (2014): use the projected momentum premium and volatility to generate dynamic weights. This is labeled Enhanced Momentum**.
As we can see, using the risk management rules turns a $1 investment in 1927 into $69 million for Enhanced Momentum* and $116 million for Enhanced Momentum**. Not bad!

The results are hypothetical results and are NOT an indicator of future results and do NOT represent returns that any investor actually attained. Indexes are unmanaged, do not reflect management or trading fees, and one cannot invest directly in an index. Additional information regarding the construction of these results is available upon request.
Table 3 (shown below) documents some summary statistics for the various strategies. Sharpe ratios (risk-adjusted) of three enhanced momentum strategies are all higher than the regular/traditional momentum strategy. The risk management helps reduce left-skewness, volatility, drawdowns and thus increase Sharpe ratios.
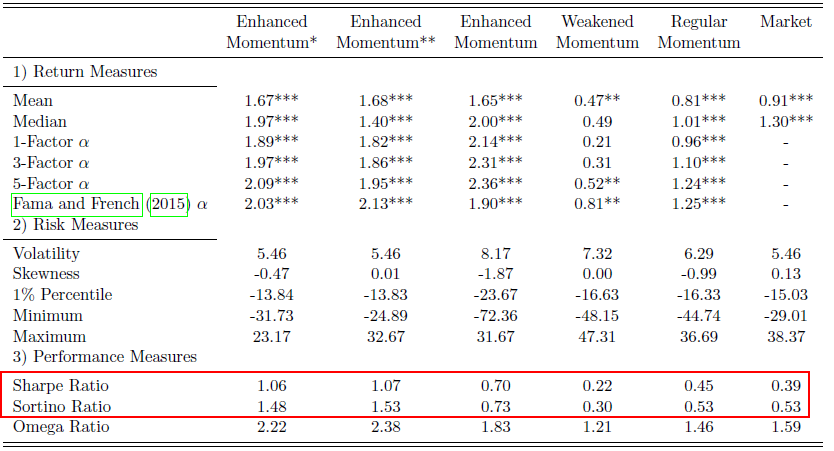
The results are hypothetical results and are NOT an indicator of future results and do NOT represent returns that any investor actually attained. Indexes are unmanaged, do not reflect management or trading fees, and one cannot invest directly in an index. Additional information regarding the construction of these results is available upon request.
This paper spends the rest of the time on robustness. It shows that such premiums have long-run persistence and also exist in international markets. It concludes that the relation between expected skewness and momentum returns is significant, even after controlling for virtually all firm characteristics (e.g. past returns, volatility, continuously arriving information/frog in pan effect, credit rating, the 52-week high or unrealized capital gains.)
Summary
This paper documents some interesting findings. However, as the paper points out, the skewness measure has no impact on the long leg of the portfolio. Thus, the results are driven by the short leg, which can have much higher costs.

About the Author: Jack Vogel, PhD
—
Important Disclosures
For informational and educational purposes only and should not be construed as specific investment, accounting, legal, or tax advice. Certain information is deemed to be reliable, but its accuracy and completeness cannot be guaranteed. Third party information may become outdated or otherwise superseded without notice. Neither the Securities and Exchange Commission (SEC) nor any other federal or state agency has approved, determined the accuracy, or confirmed the adequacy of this article.
The views and opinions expressed herein are those of the author and do not necessarily reflect the views of Alpha Architect, its affiliates or its employees. Our full disclosures are available here. Definitions of common statistics used in our analysis are available here (towards the bottom).
Join thousands of other readers and subscribe to our blog.