The holy grail of financial markets is finding strategies that have misaligned risk and reward characteristics.
In the traditional view, investors try to do the following:
- Identify strategies that have high returns, then…
- find ways to get the exposure with the lowest risk possible.
However, there is another angle on this concept…
- Identify strategies that have great risk-management benefits, then…
- find ways to get the exposure at the lowest cost possible.
For example, you might buy out of the money puts, which in a crisis will finish in the money and generate insurance-like returns. But puts might be expensive…
What if you could identify an asset where the cost of this insurance is de minimus or–better yet–you get paid to own the insurance? That is, if you commit capital, you will, in expectation, generate positive returns over time–and get an insurance benefit. This would be the holy grail!
This line of thought is a bit unorthodox, but may lead to creative portfolio solutions.
An applied example: The US Treasury Bond.
First, let’s frame the question through the typical lens: focus on expected returns first, volatility second.
Many consider the US Treasury Bond to have low expected return, but high potential risk. The low expected return is due to low yields, and the high potential risk is associated with the fact that if we were to move down the “banana republic” path, long bonds would arguably get crushed. Everyone seems to know this.
Conclusion: Bad investment.
Next, let’s frame the question through a different lens: focus on risk-management benefits first, expected returns second.
When we look at the US Treasury Bond as a risk-management instrument, we identify some amazing historical benefits that are distinct from its expected return characteristics.
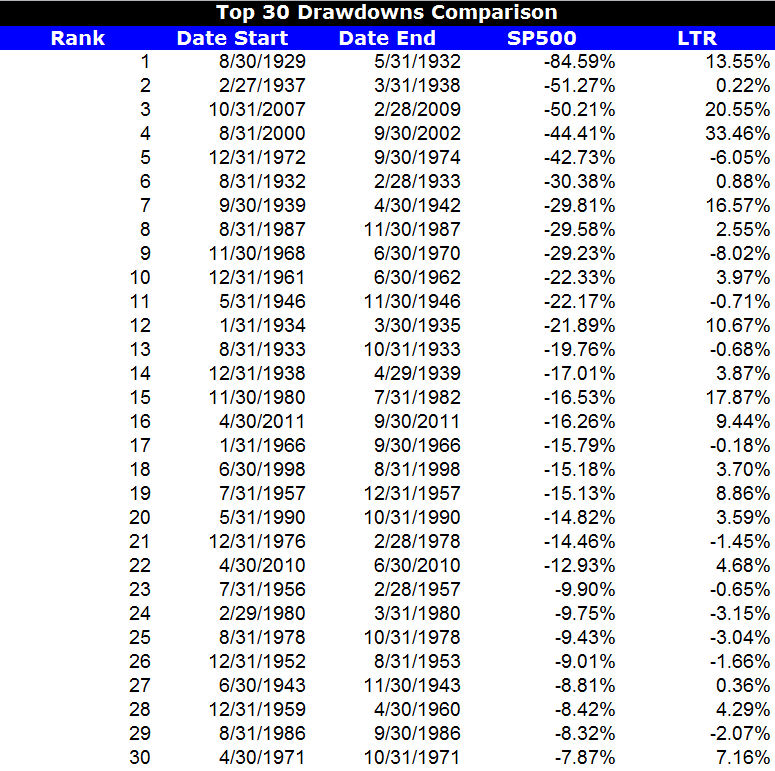
The results below highlight the top 30 drawdowns in the S&P 500 Total Return Index from 1927 to 2013. Next to the S&P 500 return is the corresponding total return on the 10-Year (LTR) over the same drawdown period:
The results are hypothetical results and are NOT an indicator of future results and do NOT represent returns that any investor actually attained. Indexes are unmanaged, do not reflect management or trading fees, and one cannot invest directly in an index. Additional information regarding the construction of these results is available upon request.
Leaving aside (for a moment) questions about long-run returns, the US Treasury Bond suddenly looks more like an insurance contract, and less like a traditional investment. Again, with a traditional investment, we would tend to focus first on expected return and standard deviation.
Conclusion: We’ve potentially identified an insurance contract that pays us to hold it.
Moving from US Treasury Bonds to Hedge Fund Factors
The example above is not meant to be a pitch for or against US Treasury Bonds. The analysis is merely meant to highlight how framing the investment decision can potentially lead to different conclusions.
In our quest to find additional low-cost–or free–portfolio insurance assets, we started playing with common “factor” returns. As insurance contracts, do these exhibit characteristics similar to what we saw before with respect to Treasury bonds? The results were surprising…
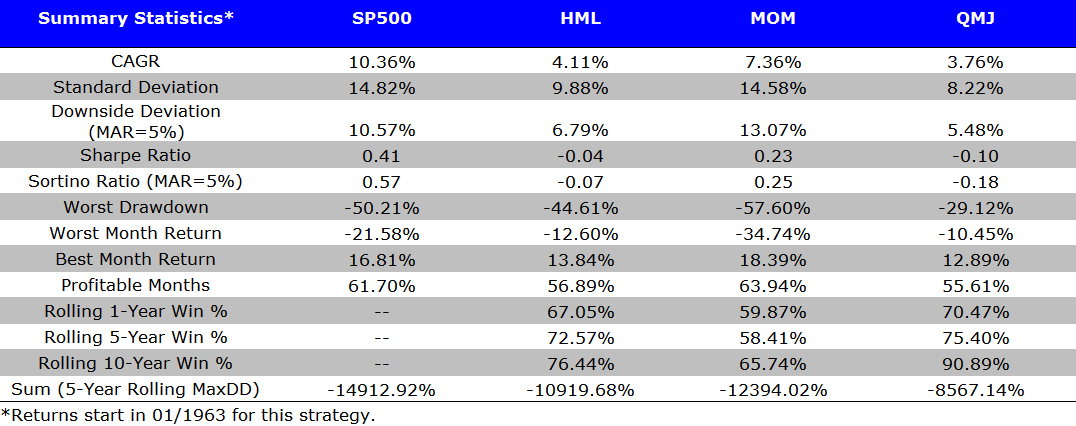
We examine 3 common hedge fund “factor” portfolios alongside the S&P 500 Index:
- SP 500 = SP 500 Total Return Index
- HML = The average of 2 value portfolios (small and large) minus the average return of two growth portfolios (again, small and large)
- MOM = The average of 2 high return portfolios (small and large) minus the average return of two low return portfolios (small and large)
- QMJ = The average of 2 high-quality portfolios (small and large) minus the average return of two low-quality portfolios (small and large)
Results are gross of management fees and transaction costs. All returns are total returns and include the reinvestment of distributions (e.g., dividends).
Data are from AQR and Ken French.
Summary Statistics:
Here are the returns (1/1/1963-12/31/2014):
The results are hypothetical results and are NOT an indicator of future results and do NOT represent returns that any investor actually attained. Indexes are unmanaged, do not reflect management or trading fees, and one cannot invest directly in an index. Additional information regarding the construction of these results is available upon request.
Conclusion: You got paid to hold the hedge fund factors over the long-term.
Insurance Benefit Analysis:
In the context of a traditional asset pricing model, such as the Capital Asset Pricing Model (CAPM), an asset that actually delivers returns when the rest of the world is blowing up (i.e., negative beta during treacherous times), should have a negative expected return because of the diversification benefits. For example, the CAPM says the expected return of an asset equals the risk-free rate plus beta times the expected excess return of the market portfolio:
ra = rrf + Ba (rm-rrf)
In this equation, if beta is negative, then the asset could earn negative returns and the investor should be happy owning it. For example, let’s say rf=3%, Rm-rf= 4%, and B=-1. The expected return = -1%.
Hence, under CAPM, you have to pay for an insurance contract.
Yet as the analysis above highlights, all of these L/S factors have positive carry. In a traditional asset pricing framework, these assets should not act like portfolio insurance.
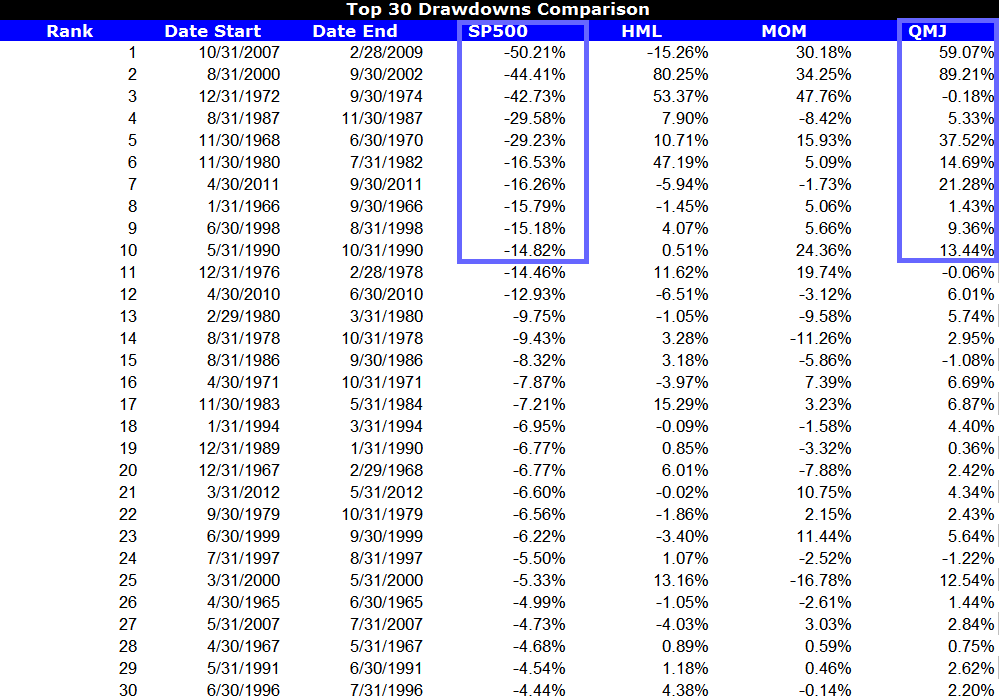
But how do these strategies perform as insurance contracts?
When we look at the worst 30 drawdowns on the SP 500 since 1963 we see a very interesting pattern–Factors tend to rip higher during crisis. In other words, hedge fund factors look and feel like insurance contracts that pay off during chaos.
The results are hypothetical results and are NOT an indicator of future results and do NOT represent returns that any investor actually attained. Indexes are unmanaged, do not reflect management or trading fees, and one cannot invest directly in an index. Additional information regarding the construction of these results is available upon request.
Conclusion: Hedge fund factors are VERY interesting in a portfolio context.

About the Author: Wesley Gray, PhD
—
Important Disclosures
For informational and educational purposes only and should not be construed as specific investment, accounting, legal, or tax advice. Certain information is deemed to be reliable, but its accuracy and completeness cannot be guaranteed. Third party information may become outdated or otherwise superseded without notice. Neither the Securities and Exchange Commission (SEC) nor any other federal or state agency has approved, determined the accuracy, or confirmed the adequacy of this article.
The views and opinions expressed herein are those of the author and do not necessarily reflect the views of Alpha Architect, its affiliates or its employees. Our full disclosures are available here. Definitions of common statistics used in our analysis are available here (towards the bottom).
Join thousands of other readers and subscribe to our blog.