Accruals, Cash Flows, and Operating Profitability in the Cross Section of Stock Returns
- Ball, Gerakos, Linnainmaa and Nikolaev
- A version of the paper can be found here.
- Want a summary of academic papers with alpha? Check out our Academic Research Recap Category.
Abstract:
Accruals are the non-cash component of earnings. They represent adjustments made to cash flows to generate a profit measure largely unaffected by the timing of receipts and payments of cash. Prior research finds that expected returns increase in firm profitability. However, firms with high accruals generate lower returns than firms with low accruals, and this “accrual anomaly” strengthens when evaluated using asset pricing models that include a profitability factor. We show that a cash-based operating profitability measure (that excludes accruals) outperforms other measures of profitability (that include accruals) and subsumes accruals in predicting the cross section of average returns. The cash-based operating profitability measure explains expected returns over a ten year horizon, which is inconsistent with initial mispricing of earnings or its cash and accruals components.
Alpha Highlight:
Accounting earnings appear to be a barometer of firm performance and are associated with future stock prices changes. An extensive body of literature has investigated various earnings-related signals, including gross profitability (Novy-Marx, 2013), operating profitability (Ball, 2014), etc. Gross profitability is under investigation from a lot of researchers. Some examples of research we’ve highlighted and discussed in the past:
- http://alphaarchitect.com/2014/06/17/gross-profits-isnt-a-silver-bullet-for-valuation-measurement/
- http://alphaarchitect.com/2015/01/28/predict-stock-returns-using-the-trend-of-profitability/
- http://alphaarchitect.com/2015/06/10/using-profitability-factor-perhaps-think-twice/
This paper digs a bit deeper into gross profitability by examining the cash component of gross profitability separately from the accrual component. Along these lines, the work of Dechow (1994) highlights the predictive power of accruals, which are the non-cash component of earnings.
Subsequently, Sloan (1996) also made contributions to a growing understanding of the “accrual anomaly,” which generally suggests that firms with small or negative accrual ratios outperform those with large ones. That said, the long/short “hedge fund” version of the accrual anomaly appears to have been partially arbitraged away — see below:
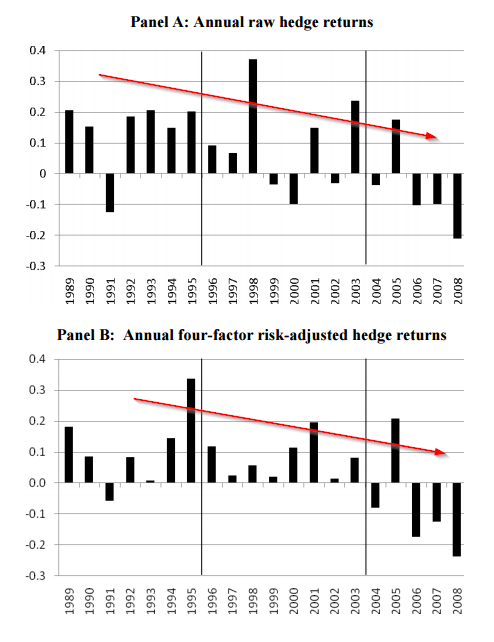
The results are hypothetical results and are NOT an indicator of future results and do NOT represent returns that any investor actually attained. Indexes are unmanaged, do not reflect management or trading fees, and one cannot invest directly in an index. Additional information regarding the construction of these results is available upon request.
Regardless of the extensive research into the accrual anomaly — both positive and negative — one thing is clear: breaking earnings into cash and accrual components is an interesting signal to explore.
This paper leverages the accrual signal in the context of examining gross profitability — a hot topic in “quant” land these days. The paper proposes that cash-based profitability is a better metric to predict stock prices than the standard gross profitability measure currently being considered:
Cash-based operating profitability (that removes accruals from operating profitability) subsumes the predictive ability of both accruals and profitability.
Key Findings:
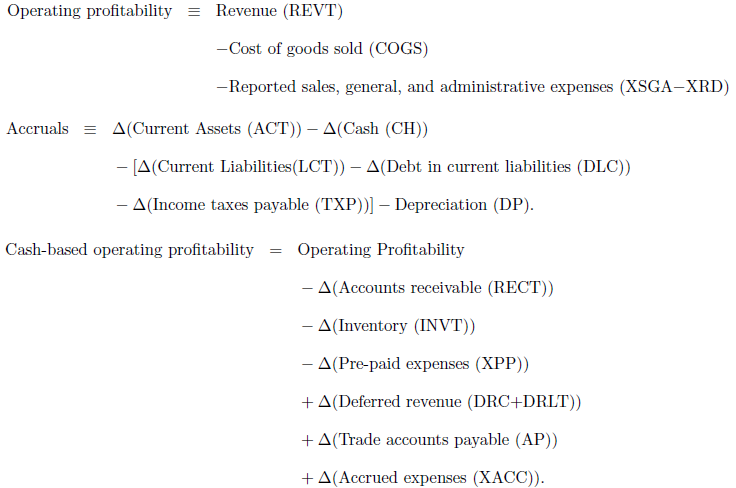
Operating profitability has two components: the cash component and the accruals component. Dechow (1994) pointed out that the role of accruals is “to facilitate the periodic measurement of firm performance”. Click to see the formulas.
Finding 1: The cash component of profitability (i.e., the difference between operating profitability and accruals) outperforms operating profitability and subsumes accruals in predicting the cross section of expected returns. Specifically:
- Firms with high operating profitability and low accruals earn higher returns; however, the relationship is driven by the cash component.
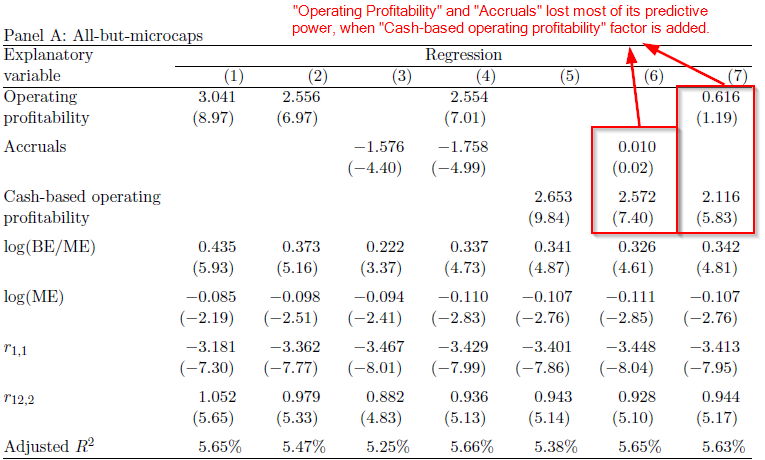
- Consider the evidence from table below: “Operating profitability” and “Accruals” lost most of their predictive power when a “Cash-based operating profitability” factor is added.
- The “accrual anomaly” disappears once we control for cash-based operating profitability.
- That is to say, if firms are sorted based on cash-based operating profitability, an additional screen using accruals adds no predictive value.
The results are hypothetical results and are NOT an indicator of future results and do NOT represent returns that any investor actually attained. Indexes are unmanaged, do not reflect management or trading fees, and one cannot invest directly in an index. Additional information regarding the construction of these results is available upon request.
Finding 2: Combining the cash-based operating profitability factor with the traditional four factors (MKT, SMB, HML, and MOM) generates the highest Sharpe ratio.
- Below graph offers vivid evidence of this finding. It shows the cumulative returns on operating profitability, accruals, cash-based operating profitability, and the market from 1963 to 2013.
- This paper also finds that the predictive ability of cash-based operating profitability is robust and strong for up to ten years into the future.
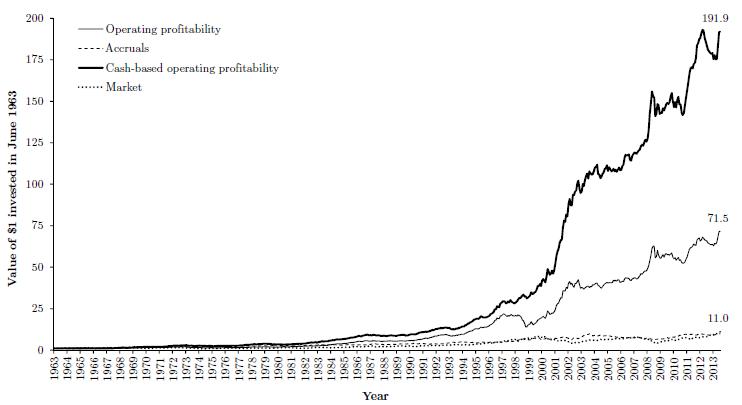
The results are hypothetical results and are NOT an indicator of future results and do NOT represent returns that any investor actually attained. Indexes are unmanaged, do not reflect management or trading fees, and one cannot invest directly in an index. Additional information regarding the construction of these results is available upon request.
Understanding the cash and non-cash component of a firm’s profitability seems to matter. We’ve known about these effects for a long time and leverage this knowledge in calculating the “quality” component of a security in our Quantitative Value investment philosophy.
Important to note, leveraging a quality metric (regardless of how you measure profitability) in the context of a cheap-stock-focused portfolio has had some serious volatility — see below from an old post:
http://alphaarchitect.com/2015/10/12/value-investing-the-pain-train-has-arrived-and-it-sucks/

About the Author: Wesley Gray, PhD
—
Important Disclosures
For informational and educational purposes only and should not be construed as specific investment, accounting, legal, or tax advice. Certain information is deemed to be reliable, but its accuracy and completeness cannot be guaranteed. Third party information may become outdated or otherwise superseded without notice. Neither the Securities and Exchange Commission (SEC) nor any other federal or state agency has approved, determined the accuracy, or confirmed the adequacy of this article.
The views and opinions expressed herein are those of the author and do not necessarily reflect the views of Alpha Architect, its affiliates or its employees. Our full disclosures are available here. Definitions of common statistics used in our analysis are available here (towards the bottom).
Join thousands of other readers and subscribe to our blog.