I just got back from the Value Investing Congress–http://www.valueinvestingcongress.com/. The event was exceptional and very thought-provoking.
While Einhorn’s annihilation of Green Mountain Coffee was impressive (here is Einhorn’s theme song), and Whitney Tilson’s outline of the opportunity in Berkshire Hathaway was compelling, the speaker that I enjoyed most was Joel Greenblatt.
Joel’s content was certainly not new and/or interesting to me, however, the audience’s reactions and questions were entertaining. I’ll summarize (gross approximation) the conversation between Joel and the audience:
Joel: “Quantitative value investing is a compelling way to earn solid returns and deploy large amounts of capital in a cost-effective manner”
Audience: “But Joel, the top decile for the Magic Formula’s returns are around 15%, which are better than 95% of our returns. Are you suggesting that all of us who paid $2,400 for the conference and have spent our lives picking stocks are wasting our time?”
Joel: “Yes, exactly”
Interestingly, during the coffee break Joel passed by our table with a gaggle of groupies. The conversation we overheard went like this:
Groupie 1: “Joel, why not do the Magic Formula on the short-side? This seems like a compelling opportunity!”
Joel: “Because you will go broke.”
Me and the gang at my table: “Ha!”
“Because you will go broke”
What does Joel mean by “because you’ll go broke?”
First, a graph from our backtesting module on Turnkey Analyst (free if you sign up for an account). This chart shows the performance of the top 10% magic formula stocks and the bottom 10% magic formula stocks from Jan 1998–Dec 2002. You’ll notice an ugly spread at the height of the internet bubble.

The results are hypothetical results and are NOT an indicator of future results and do NOT represent returns that any investor actually attained. Indexes are unmanaged, do not reflect management or trading fees, and one cannot invest directly in an index. Additional information regarding the construction of these results is available upon request.
Ouch.
Let’s dig a littler deeper in to the performance of the magic formula long/short:
First, how about some basics (CAGR, vol, alpha, beta exposures, etc.):
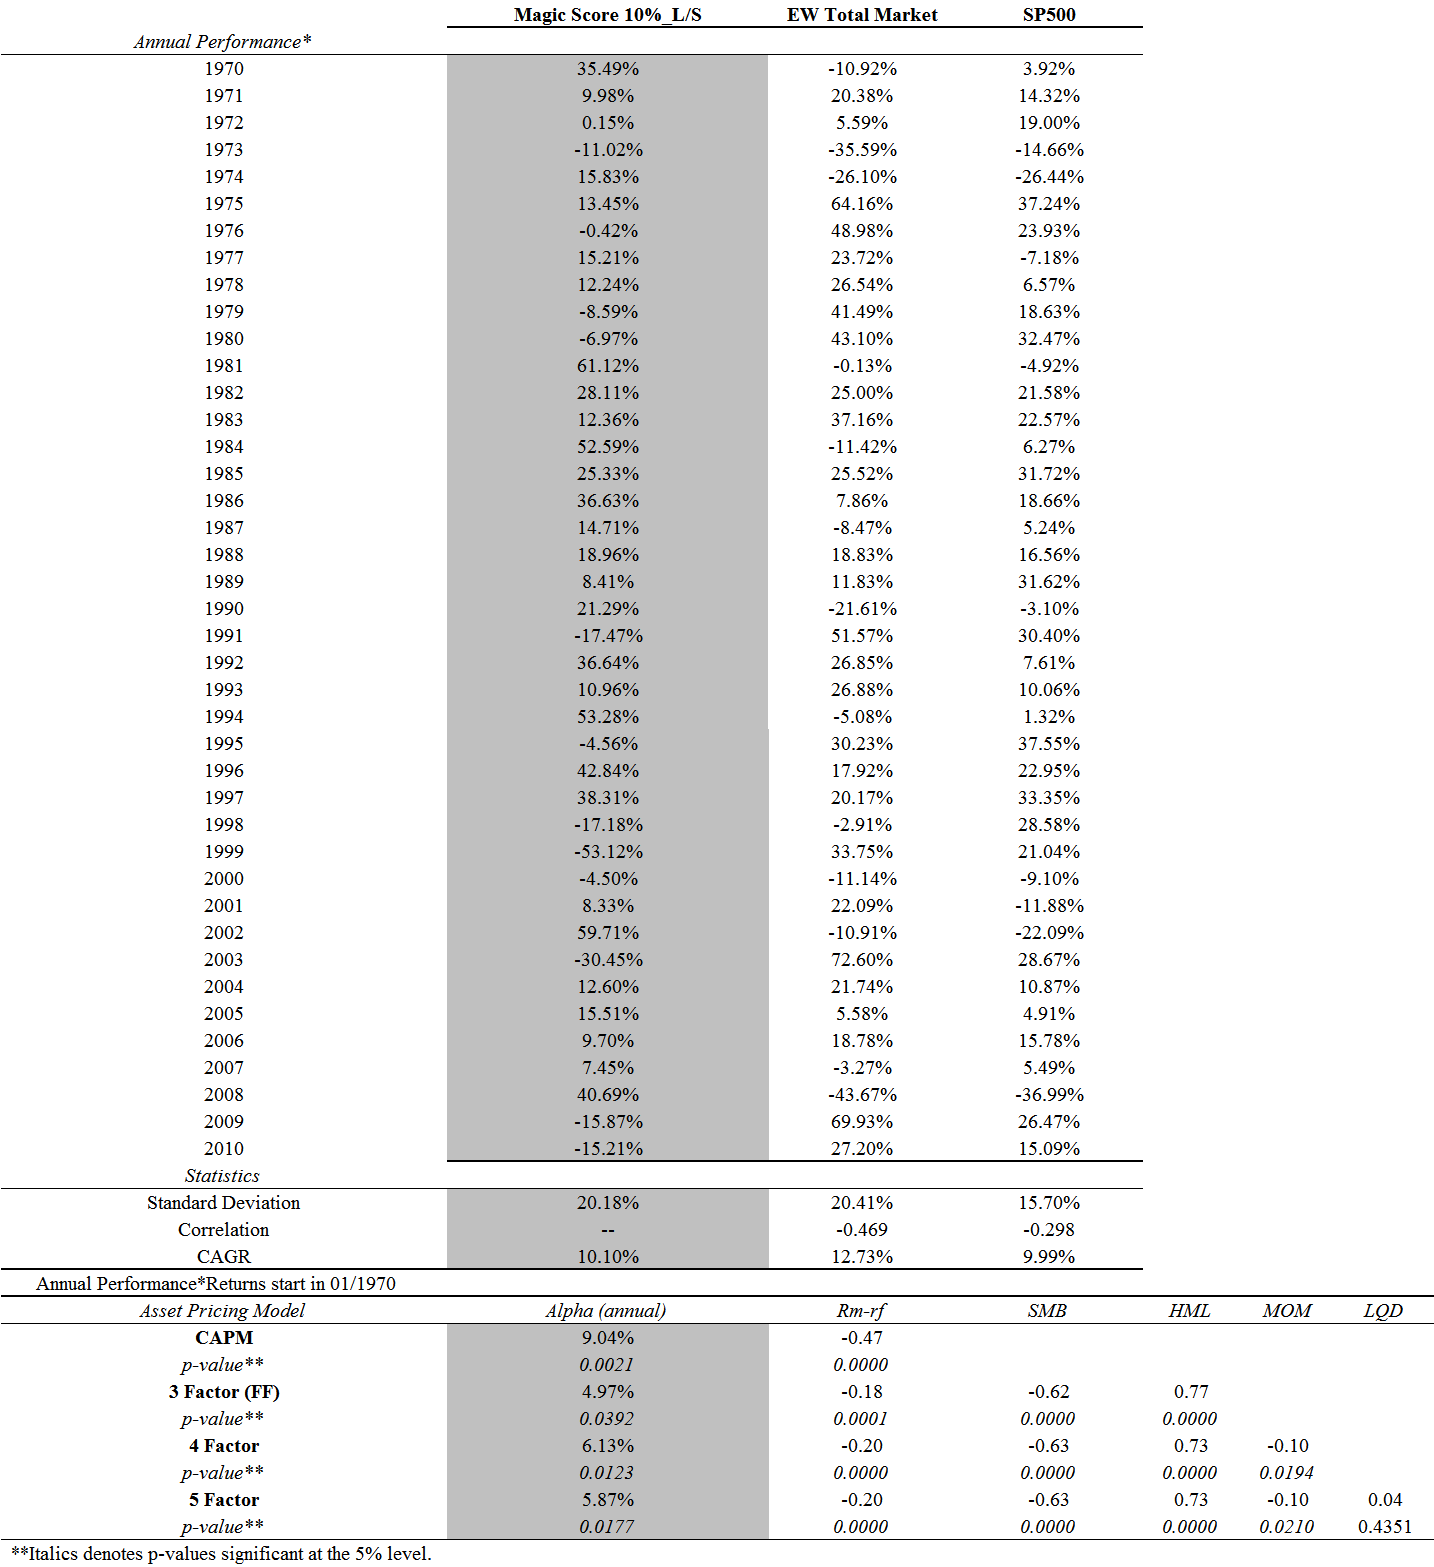
The results are hypothetical results and are NOT an indicator of future results and do NOT represent returns that any investor actually attained. Indexes are unmanaged, do not reflect management or trading fees, and one cannot invest directly in an index. Additional information regarding the construction of these results is available upon request.
Okay, so things look kinda pretty from that angle: 5-10% annual alpha, negative beta exposure, and a decent 10% CAGR. A theoretical dream asset for a pension fund looking for an instrument with negative beta, but positive return!
How about the cumulative return chart? HOLY SNIKES. This is Bill Miller deja vu! For almost 30 years a L/S magic formula investor would have enjoyed one of the more admirable track records known to the investment world–a Jim Simmons in the making. But when ’99 comes around it is almost entirely erased–incredible, fascinating, scary, and downright heart-pounding.
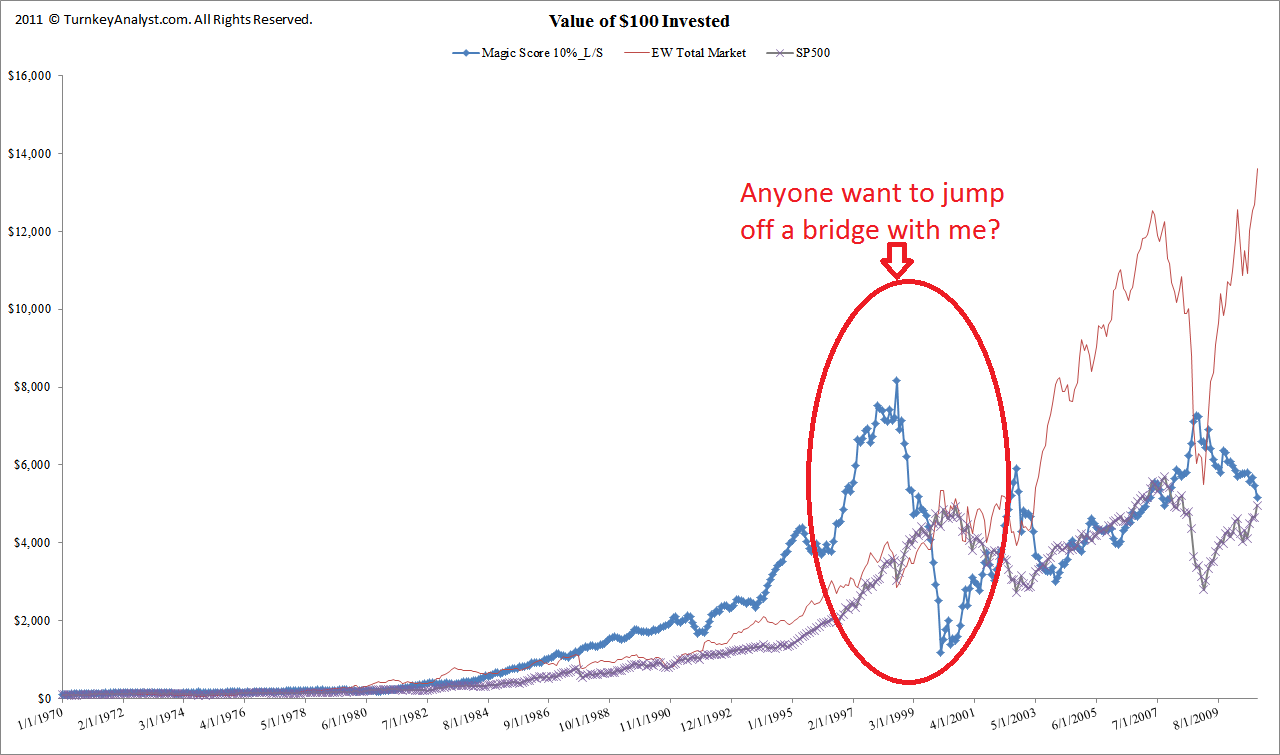
The results are hypothetical results and are NOT an indicator of future results and do NOT represent returns that any investor actually attained. Indexes are unmanaged, do not reflect management or trading fees, and one cannot invest directly in an index. Additional information regarding the construction of these results is available upon request.
Just how bad is the drawdown during the internet bubble?
How about -86% bad!
The drawdown runs from Sept 98–Feb 00.
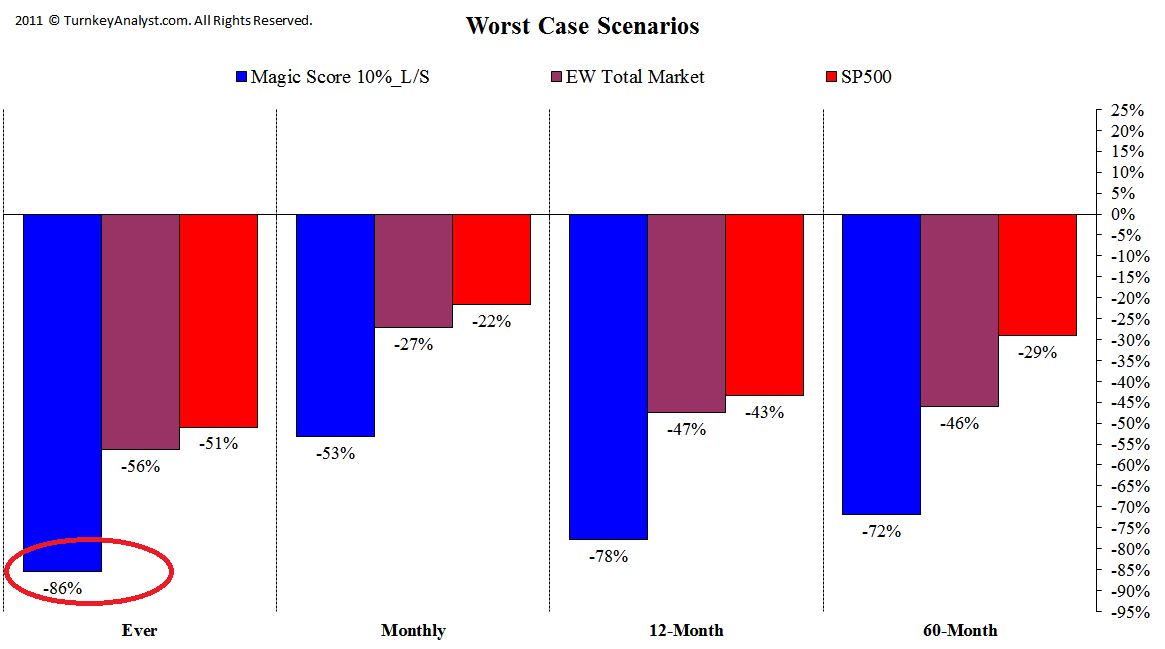
The results are hypothetical results and are NOT an indicator of future results and do NOT represent returns that any investor actually attained. Indexes are unmanaged, do not reflect management or trading fees, and one cannot invest directly in an index. Additional information regarding the construction of these results is available upon request.
So let’s put the L/S in perspective. L/S is all about risk management: -86% is not risk management.
Lesson learned:
When Joel Greenblatt says, “Because you’ll go broke,” now you’ll know why!

About the Author: Wesley Gray, PhD
—
Important Disclosures
For informational and educational purposes only and should not be construed as specific investment, accounting, legal, or tax advice. Certain information is deemed to be reliable, but its accuracy and completeness cannot be guaranteed. Third party information may become outdated or otherwise superseded without notice. Neither the Securities and Exchange Commission (SEC) nor any other federal or state agency has approved, determined the accuracy, or confirmed the adequacy of this article.
The views and opinions expressed herein are those of the author and do not necessarily reflect the views of Alpha Architect, its affiliates or its employees. Our full disclosures are available here. Definitions of common statistics used in our analysis are available here (towards the bottom).
Join thousands of other readers and subscribe to our blog.