The following summary is from our academic alpha database at http://alpha.turnkeyanalyst.com/ideas/55.
Title: Corporate Real Estate Holdings and the Cross Section of Stock Returns
Authors: Selale Tuzel
Category: Equity alpha
Alpha: .50-.75%
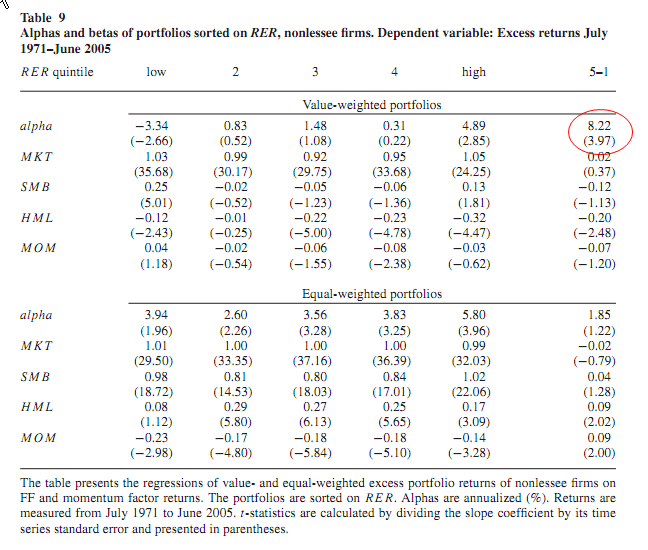
Alpha remarks: Table 6 suggest an annual alpha of 8.22%, ~68bp monthly, for VW long/short portfolios
The results are hypothetical results and are NOT an indicator of future results and do NOT represent returns that any investor actually attained. Indexes are unmanaged, do not reflect management or trading fees, and one cannot invest directly in an index. Additional information regarding the construction of these results is available upon request.
Readability: 4
Blog link: N/A
Abstract:
This article explores the link between the composition of firms’ capital and stock returns. I develop a general equilibrium production economy where firms use two factors: real estate and other capital. Investment is subject to asymmetric adjustment costs. Because real estate depreciates slowly, firms with high real estate holdings are more vulnerable to bad productivity shocks and hence are riskier and have higher expected returns. This prediction is supported empirically. I find that the returns of firms with a high share of real estate capital exceed that of low real estate firms by 3–6% annually, adjusted for exposures to the market return, size, value, and momentum factors. Moreover, conditional beta estimates reveal that these firms indeed have higher market betas, and the spread between the betas of high and low real estate firms is countercyclical.
Summary:
- Compute Rental Expense/Gross PPE and eliminate firms with greater than 5%
- Compute the RER for every firm: RER= (building & cap leases/PPE(firm) – building & cap leases/PPE(industry))
- Go long Higher RER firms and go short low RER firms
- Capture a 8.22% annualized alpha (see table 9)
- Make money
Commentary:
- Equal-weight results show alphas in the 4-6% range for all quintiles, suggesting that the effect might be driven by large firms.
- Alphas are small, especially when they are industry-adjusted (see table 7)
- Alphas can be enhanced if the investor excludes firms that have rental expense/Gross PPE that is greater than 5%.
Other Resources:
http://alpha.turnkeyanalyst.com/ideas/55

About the Author: Wesley Gray, PhD
—
Important Disclosures
For informational and educational purposes only and should not be construed as specific investment, accounting, legal, or tax advice. Certain information is deemed to be reliable, but its accuracy and completeness cannot be guaranteed. Third party information may become outdated or otherwise superseded without notice. Neither the Securities and Exchange Commission (SEC) nor any other federal or state agency has approved, determined the accuracy, or confirmed the adequacy of this article.
The views and opinions expressed herein are those of the author and do not necessarily reflect the views of Alpha Architect, its affiliates or its employees. Our full disclosures are available here. Definitions of common statistics used in our analysis are available here (towards the bottom).
Join thousands of other readers and subscribe to our blog.