A guest speaker in my lecture last week mentioned something interesting:
Apple looks like a growth stock on a P/E basis, but when you strip out the cash horde and examine the cash-adjusted P/E ratio, Apple is selling at 7-8x.
I followed up with this comment and googled around a bit to find articles on the subject. As expected, there is a belief that cash-adjusted P/E ratios are important for stock performance. This certainly seems like a reasonable idea. Here are some articles on the subject:
- http://beta.fool.com/apinkasovitch/2012/03/10/apple-growth-value-stock/2774/
- http://macromon.wordpress.com/2012/02/07/apples-unbelievable-valuation-price-sensitivity-analysis/
- http://www.postsateventide.com/2011/02/apples-pe-multiple-with-and-without.html
- http://seekingalpha.com/article/569461-why-the-market-is-valuing-nvidia-incorrectly
As a natural skeptic, I love to examine unproven “common wisdom” and “rules of thumb.”
Hypothesis:
- Investors who look at P/E ratios, without adjusting for “cash,” may incorrectly identify a stock as “expensive,” when the reality is the stock is “cheap.”
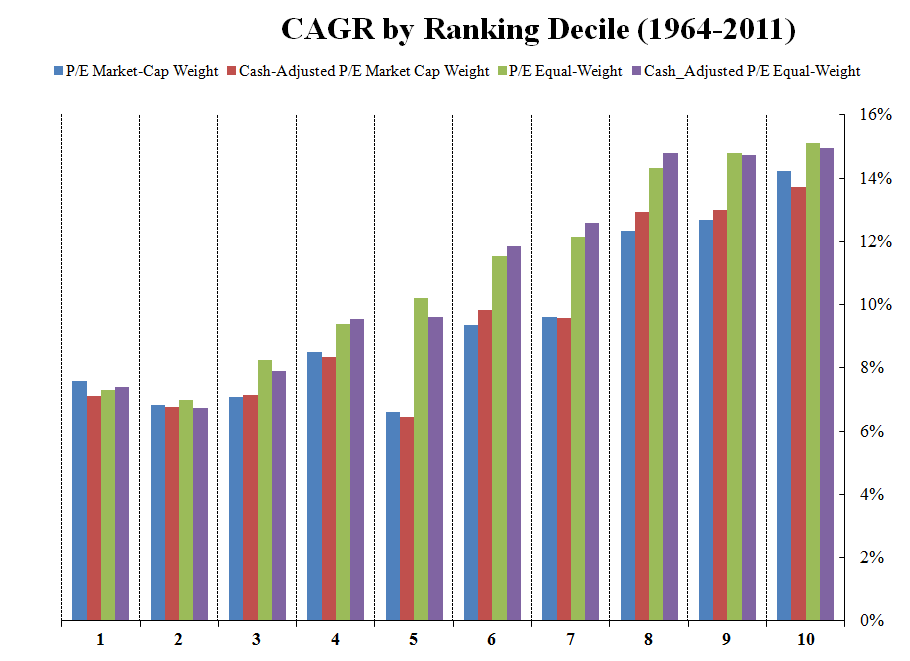
A natural way to test this hypothesis is to examine the performance of stocks on a P/E basis and a “cash-adjusted” P/E basis. We perform this analysis on the universe of all NYSE/AMEX/NASDAQ stocks. For these figures we simply sort the universe of firms each June 30th into ten decile bins based on P/E or cash-adjusted P/E. We examine equal-weight portfolios and market-cap weighted portfolios. We eliminate all firms in the bottom 20 percentile of market cap to ensure micro-caps do not drive the results.

[click to enlarge] The results are hypothetical results and are NOT an indicator of future results and do NOT represent returns that any investor actually attained. Indexes are unmanaged, do not reflect management or trading fees, and one cannot invest directly in an index. Additional information regarding the construction of these results is available upon request.

[click to enlarge] The results are hypothetical results and are NOT an indicator of future results and do NOT represent returns that any investor actually attained. Indexes are unmanaged, do not reflect management or trading fees, and one cannot invest directly in an index. Additional information regarding the construction of these results is available upon request.
It doesn’t seem that cash-adjusted P/E is any more powerful in predicting future performance than the stand-alone P/E.
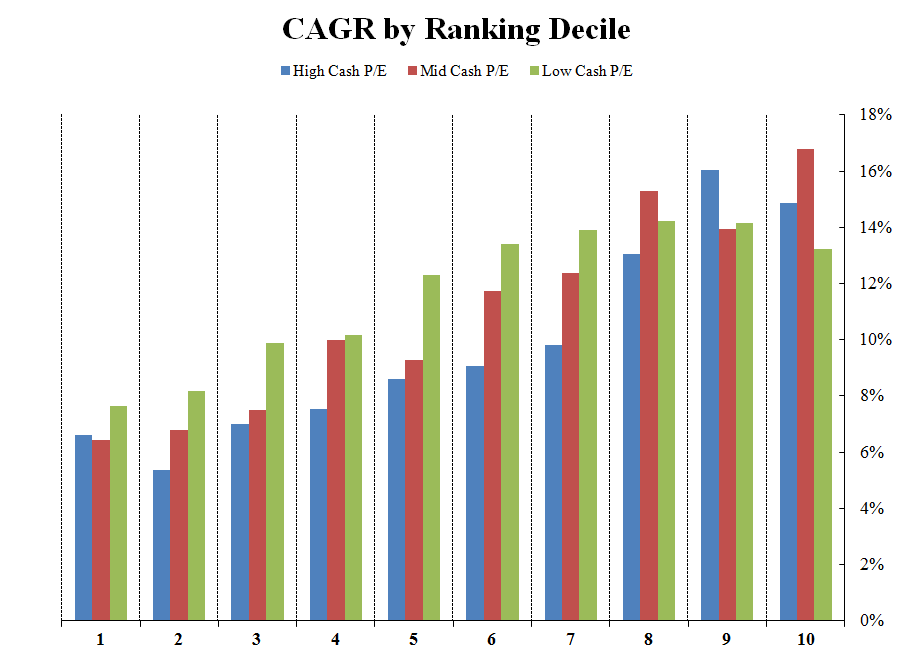
A more sophisticated way to analyze the hypothesis is to look at P/E deciles, and then sort within these deciles on Cash P/E. The basic idea is that holding constant P/E, low Cash-adjusted P/E firms should outperform high cash-adjusted P/E firms. Or in other words, stocks like Apple that have a high P/E, but a low cash P/E should outperform, on average, those firms with equally high P/Es, but higher relative cash-adjusted P/E.
The theory makes sense, but what do the data say:

[click to enlarge] The results are hypothetical results and are NOT an indicator of future results and do NOT represent returns that any investor actually attained. Indexes are unmanaged, do not reflect management or trading fees, and one cannot invest directly in an index. Additional information regarding the construction of these results is available upon request.
In the 1st decile (glamour stocks), seperating the universe on cash-adjusted P/E doesn’t really do anything–maybe adds 50-60bps, which is statistically no different. We get an odd result for the 10th decile (value), where the low cash-adjusted P/Es actually perform worse! There is a bit of evidence in deciles 2-8, suggesting that investors may not appreciate cash-adjusted P/Es as much as they should. Of course, slight changes in methodology (market-cap weight vs equal-weight, include negative P/E firms vs exclude negative P/E firms, and so forth) jumble up this chart. Overall, there is certainly no systematic or pervasive evidence that focusing on cash-adjusted P/E is a magic bullet. From a statistical standpoint, it really doesn’t matter. However, from a point estimate perspective, using a cash-adjusted P/E might work for stocks that are neither extreme growth or extreme value (ie bins in the middle).
Conclusions:
We are just beginning this research project and plan to have a working paper out in the next few weeks with all the details. In the meantime, be weary of reports wielding the “cash-adjusted P/E turns this growth stock into a value stock” answer. In the end, buying any stock with an extemely high P/E (cash-adjusted or not) is a bad bet, on average, and buying any stock with a very low P/E tends to be a good bet.
About the Author: Wesley Gray, PhD
—
Important Disclosures
For informational and educational purposes only and should not be construed as specific investment, accounting, legal, or tax advice. Certain information is deemed to be reliable, but its accuracy and completeness cannot be guaranteed. Third party information may become outdated or otherwise superseded without notice. Neither the Securities and Exchange Commission (SEC) nor any other federal or state agency has approved, determined the accuracy, or confirmed the adequacy of this article.
The views and opinions expressed herein are those of the author and do not necessarily reflect the views of Alpha Architect, its affiliates or its employees. Our full disclosures are available here. Definitions of common statistics used in our analysis are available here (towards the bottom).
Join thousands of other readers and subscribe to our blog.

