Risk Premia Harvesting Through Momentum
- Gary Antonacci
- A version of the paper can be found here.
Abstract:
“Momentum is the premier market anomaly. It is nearly universal in its applicability. Rather than focus on momentum applied to particular assets or asset classes, this paper explores momentum with respect to what makes it most effective. We do this by first combining cross-sectional relative strength momentum with time series momentum. We then explore the factor most rewarded by momentum – extreme past returns, i.e., price volatility. We identify high volatility through the risk premiums in foreign/U.S. equities, high yield/credit bonds, equity/mortgage REITs, and gold/Treasury bonds. Using modules of asset pairs as building blocks lets us isolate volatility related risk factors and use momentum to effectively harvest risk premium profits.”
Data Sources:
For equities, the authors use the MSCI US, MSCI EAFE, and MSCI ACWI ex US indices. For Treasury bills, they use the Bank of America Merrill Lynch 3-Month Treasury bill Index. All other bond indices are from Barclays Capital. REIT data is from the FTSE NAREIT U.S. Real Estate Indices of the National Association of Real Estate Investment Trusts (NAREIT). Gold returns using the London PM gold fix are from the World Gold Council. All monthly return data begins on January 1974 and run through December 2011, unless otherwise noted, and includes interest and dividends.
Discussion:
In this article, the author tests how risk factors indicating high volatility contribute to momentum profitability. Using thirty-eight years of past performance data, their macro momentum modules show significant performance improvements in equities, credit risk, real estate, and economic stress.
Equities
The authors introduce a hurdle rate/alternative asset form of time series momentum to help ensure that momentum is positive on an absolute, as well as a relative, basis. Next, the authors apply relative and absolute momentum measures to the MSCI U.S. and EAFE+ stock market indices in order to create a baseline equities momentum portfolio.
Table 1 presents the summary statistics for momentum strategy with and without the use of Treasury bills as a hurdle rate. When the trading rules tell the system to get out of the asset class, the proceeds earn the treasury bill rate.

The results are hypothetical results and are NOT an indicator of future results and do NOT represent returns that any investor actually attained. Indexes are unmanaged, do not reflect management or trading fees, and one cannot invest directly in an index. Additional information regarding the construction of these results is available upon request.
Momentum without Treasury bills as a trend filter and alternative asset performs best (assuming Momentum means without adjusting for treasury bond return. The labeling of the tables and the discussion of the results is confusing in the paper). There is an impressive increase in returns and a reduction in volatility relative to the buy-and-hold indexes. The Sharpe ratio nearly doubles and drawdowns are cuts in half.
The author compares their momentum strategy with the AQR stock momentum index, which is composed of the top one-third of the Russell 1000 stocks based on twelve-month momentum with a one-month lag. But their macro equity module results are still better.
Bonds
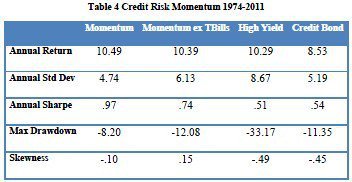
In bonds, the author utilizes the Merrill Lynch Cash Pay U.S. High Yield Index and the Barclays Capital U.S. Intermediate Credit Bond Index to test momentum on bonds.
The results are hypothetical results and are NOT an indicator of future results and do NOT represent returns that any investor actually attained. Indexes are unmanaged, do not reflect management or trading fees, and one cannot invest directly in an index. Additional information regarding the construction of these results is available upon request.
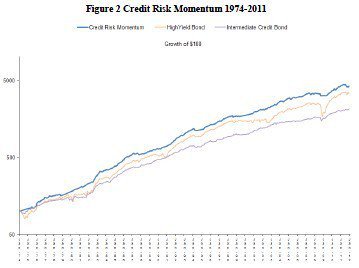
In Table 4, we see that applying momentum to the high yield and credit bond indices produces a high Sharpe ratio, has a lower standard deviation and drawdown than the high yield bond index.
The author then compares their strategy with PIMCO Total Return Institutional Fund (the best regular U.S. bond fund over the past 20+ years on an ex-post, risk adjusted basis). The relative performance is great.
The results are hypothetical results and are NOT an indicator of future results and do NOT represent returns that any investor actually attained. Indexes are unmanaged, do not reflect management or trading fees, and one cannot invest directly in an index. Additional information regarding the construction of these results is available upon request.
Real Estate
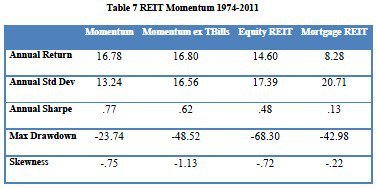
In real estate, the author looks at the use of equity and mortgage REITs and applies the momentum filter. (The REITs are apparently identified from the Morningstar Real Estate Index)
The results are hypothetical results and are NOT an indicator of future results and do NOT represent returns that any investor actually attained. Indexes are unmanaged, do not reflect management or trading fees, and one cannot invest directly in an index. Additional information regarding the construction of these results is available upon request.
Table 7 shows significantly higher returns, higher Sharpe ratio and substantially lower standard deviation and drawdown from momentum.
Economic Stress (Gold and Treasury Bonds)
The results are hypothetical results and are NOT an indicator of future results and do NOT represent returns that any investor actually attained. Indexes are unmanaged, do not reflect management or trading fees, and one cannot invest directly in an index. Additional information regarding the construction of these results is available upon request.
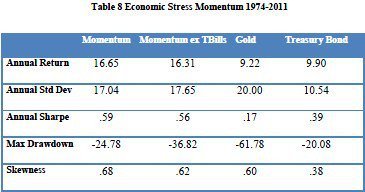
In economic stress and uncertainty, the author uses the Barclays Capital U.S. Treasury 20+ year bond index and gold, which respond positively to economic stress.
Compared with gold or Treasury bond, the momentum strategy between these two assets offers high risk-adjusted returns.
The Combination
The finale comes in the form of the combination portfolio, which equals weights the momentum returns from the Equity, Bond, Real Estate and Economic Stress momentum portfolios.
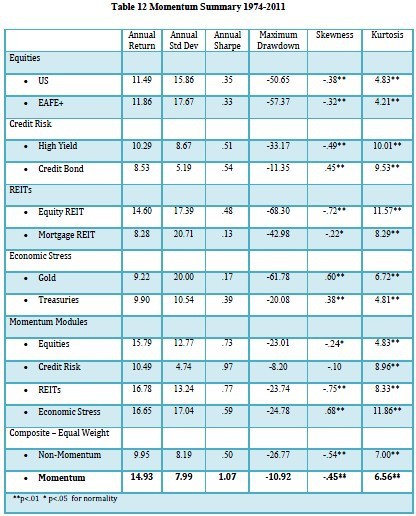
The results are hypothetical results and are NOT an indicator of future results and do NOT represent returns that any investor actually attained. Indexes are unmanaged, do not reflect management or trading fees, and one cannot invest directly in an index. Additional information regarding the construction of these results is available upon request.
The backtested results are great: 14.93% CAGR with a -10.92% drawdown…not bad!
Investment Strategy:
- Determine absolute and relative momentum within an asset category; long only when both absolute and relative momentum is positive.
- Equal-weight each system.
- Make money.
Commentary:
Diversification is considered the only free lunch in the investment world. This paper suggests that momentum is probably the other free lunch.

About the Author: Tian Yao
—
Important Disclosures
For informational and educational purposes only and should not be construed as specific investment, accounting, legal, or tax advice. Certain information is deemed to be reliable, but its accuracy and completeness cannot be guaranteed. Third party information may become outdated or otherwise superseded without notice. Neither the Securities and Exchange Commission (SEC) nor any other federal or state agency has approved, determined the accuracy, or confirmed the adequacy of this article.
The views and opinions expressed herein are those of the author and do not necessarily reflect the views of Alpha Architect, its affiliates or its employees. Our full disclosures are available here. Definitions of common statistics used in our analysis are available here (towards the bottom).
Join thousands of other readers and subscribe to our blog.