This is the third part in our series on tactical asset allocation. In the series we highlight the equal-weight with moving average tactical asset allocation system (ew_index_ma)
(If you’d like to trade these strategies simply use our web-based application. This is free–simple click here to login).
Equal-Weight Tactical Asset Allocation with Moving Average Rules
The equal-weight system with moving average rules is a simple model: an investor simply invests 1/n in each asset class, rebalanced monthly, and applies a long-term moving average rule to each asset category. Our asset classes are described below.
How does the moving average rule work?
Academic research on asset allocation clings to the tenants of mean variance optimization and concludes that investors should hold the market portfolio, or the portfolio of all risky assets weighted by their respective value in the market portfolio. But how does the theoretical answer actually stack up against the very simple equal-weight strategy?
Mebane Faber has a paper outlining the basics of the moving average trading rule. Here is how it works in a nutshell:
- Calculate the long-term moving average for each asset class. Let’s take the 12-month as an example: Average(the last 12 month-end prices).
- Compare the long-term moving average with the current asset class price. For example, look at the current price of the S&P 500, say 1,400, and compare that with the recent 12-month MA, say 1,200.
- If current price > 12-month MA, maintain position; else, if current price < 12-month MA, move assets to cash and collect the risk-free rate.
Here are some additional pieces on the subject written by fellow bloggers/researchers:
- http://www.forbes.com/sites/advisor/2012/04/09/tactical-asset-allocation-can-improve-risk-adjusted-returns/
- http://papers.ssrn.com/sol3/papers.cfm?abstract_id=1762118
- http://papers.ssrn.com/sol3/papers.cfm?abstract_id=2135337
- http://papers.ssrn.com/sol3/papers.cfm?abstract_id=1656460
- http://papers.ssrn.com/sol3/papers.cfm?abstract_id=1926376
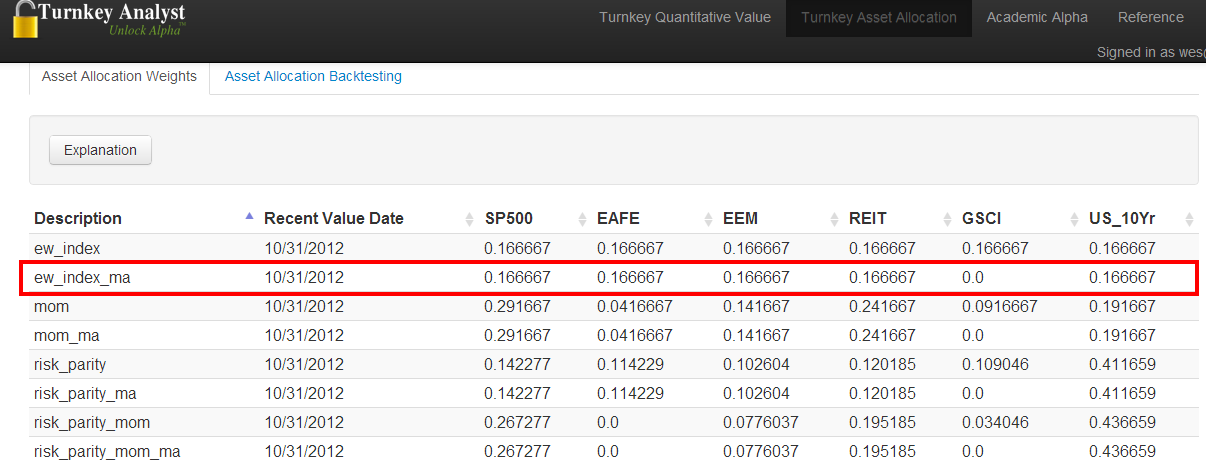
Use our tool to generate the latest weights for the equal-weight with MA rule:
The results are hypothetical results and are NOT an indicator of future results and do NOT represent returns that any investor actually attained. Indexes are unmanaged, do not reflect management or trading fees, and one cannot invest directly in an index. Additional information regarding the construction of these results is available upon request.
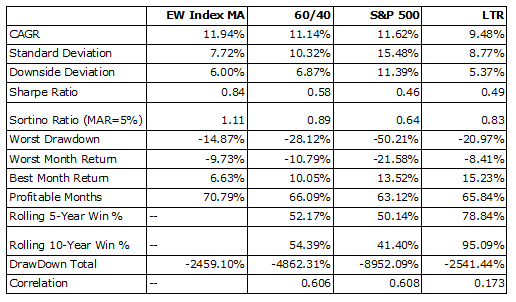
Here are the performance stats over time (January 1, 1979 to August 31, 2012):
The results are hypothetical results and are NOT an indicator of future results and do NOT represent returns that any investor actually attained. Indexes are unmanaged, do not reflect management or trading fees, and one cannot invest directly in an index. Additional information regarding the construction of these results is available upon request.
The equal-weight strategy with long-term moving average rules reduces risk relative to all other benchmarks.A few takeaways:
- Drawdowns are cut in half–at least.
- Moving average rules have historically performed very well.
Additional thoughts/ideas:
- Using fancier moving-average rules doesn’t add much at the margin. As long as you have something reasonably long-term (9+ months), the MA rule will work in your favor.
- Using total return prices or “normal” prices doesn’t matter.
- Eliminating particular asset classes from the basket doesn’t matter.
- Results aren’t contingent on LTR.
All our models and their basic explanations follow:
Core 6:
- SP500=Standard and Poors 500 Total Return Index
- EAFE=The MSCI EAFE Total Return Index
- EEM=MSCI Emerging Markets Total Return Index
- REIT=FTSE NAREIT All Equity REIT Total Return Index
- GSCI=S&P GSCI Total Return Index
- US_10Yr=Merril Lynch US Treasury 10-Year Treasury Futures Total Return Index
Models:
- ew_index=equal-weight Core 6.
- ew_index_ma=equal-weight Core 6 with 12-month moving average trading rule.
- mom=equal-weight Core 6 shifted by relative 12-month momentum.
- mom_ma=mom strategy with 12-month moving average trading rule.
- risk_parity=unlevered risk parity for Core 6.
- risk_parity_ma=unlevered risk parity for Core 6 with 12-month moving average trading rule.
- risk_parity_mom=unlevered risk parity weights for Core 6, adjusted by relative 12-month momentum.
- risk_parity_mom_ma=unlevered risk parity weights for Core 6, adjusted by relative 12-month momentum, with a 12-month moving average trading rule.
Disclosure:
Performance figures contained herein are hypothetical, unaudited and prepared by Alpha Architect, LLC; hypothetical results are intended for illustrative purposes only.
Past performance is not indicative of future results, which may vary.
There is a risk of substantial loss associated with trading commodities, futures, options and other financial instruments. Before trading, investors should carefully consider their financial position and risk tolerance to determine if the proposed trading style is appropriate. Investors should realize that when trading futures, commodities and/or granting/writing options one could lose the full balance of their account. It is also possible to lose more than the initial deposit when trading futures and/or granting/writing options. All funds committed to such a trading strategy should be purely risk capital.
Hypothetical performance results (e.g., quantitative backtests) have many inherent limitations, some of which, but not all, are described herein. No representation is being made that any fund or account will or is likely to achieve profits or losses similar to those shown herein. In fact, there are frequently sharp differences between hypothetical performance results and the actual results subsequently realized by any particular trading program. One of the limitations of hypothetical performance results is that they are generally prepared with the benefit of hindsight. In addition, hypothetical trading does not involve financial risk, and no hypothetical trading record can completely account for the impact of financial risk in actual trading. For example, the ability to withstand losses or adhere to a particular trading program in spite of trading losses are material points which can adversely affect actual trading results. The hypothetical performance results contained herein represent the application of the quantitative models as currently in effect on the date first written above and there can be no assurance that the models will remain the same in the future or that an application of the current models in the future will produce similar results because the relevant market and economic conditions that prevailed during the hypothetical performance period will not necessarily recur. There are numerous other factors related to the markets in general or to the implementation of any specific trading program which cannot be fully accounted for in the preparation of hypothetical performance results, all of which can adversely affect actual trading results. Hypothetical performance results are presented for illustrative purposes only.
Indexes are unmanaged, do not reflect management or trading fees, and one cannot invest directly in an index.
There is no guarantee, express or implied, that long-term return and/or volatility targets will be achieved. Realized returns and/or volatility may come in higher or lower than expected.

About the Author: Wesley Gray, PhD
—
Important Disclosures
For informational and educational purposes only and should not be construed as specific investment, accounting, legal, or tax advice. Certain information is deemed to be reliable, but its accuracy and completeness cannot be guaranteed. Third party information may become outdated or otherwise superseded without notice. Neither the Securities and Exchange Commission (SEC) nor any other federal or state agency has approved, determined the accuracy, or confirmed the adequacy of this article.
The views and opinions expressed herein are those of the author and do not necessarily reflect the views of Alpha Architect, its affiliates or its employees. Our full disclosures are available here. Definitions of common statistics used in our analysis are available here (towards the bottom).
Join thousands of other readers and subscribe to our blog.