I spend way too much time thinking about tactical asset allocation (TAA).
I estimate we have tested around a 1000 perturbations of TAA models (maybe more).
Some models work well, others not so well.
After torturing the data like no other, a lightbulb went off in my head…
What if tactical asset allocation is all hocus pocus???
A nice question, but how would one assess this statement?
I built a simulation model that incorporates a random tactical asset allocation rule. How does this rule work?
- If a random number generator (0=<x=<1) is less than .33333, invest in t-bills,
- Otherwise, stay in the SP 500 Index (Total Return)
So easy homer can do it:
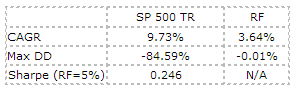
Here are the baseline stats on the Buy and Hold (B&H) SP 500 Total Return Index and the T-Bill from 1/1/1927 through 12/31/2012:
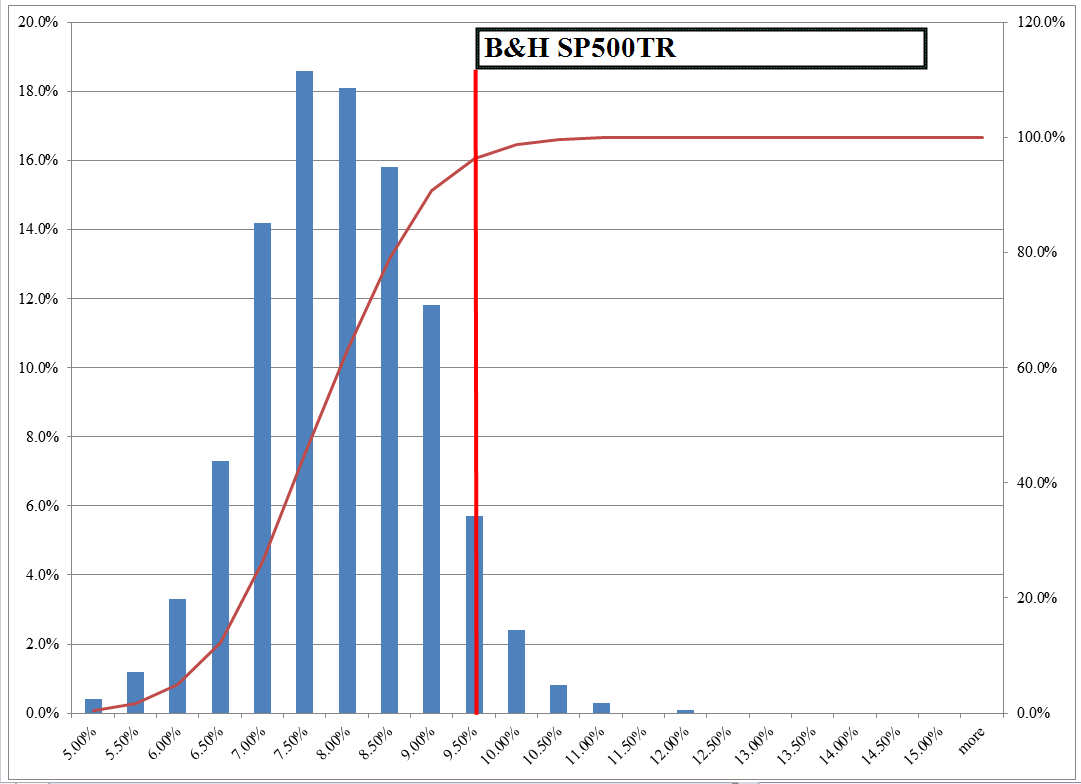
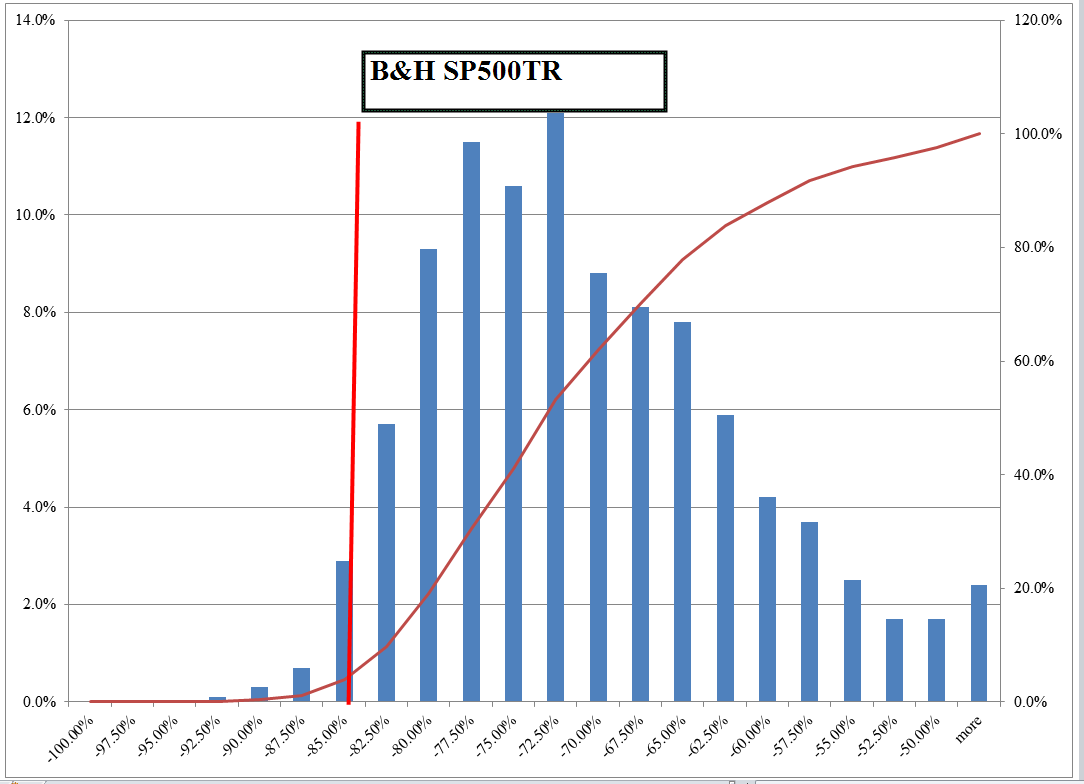
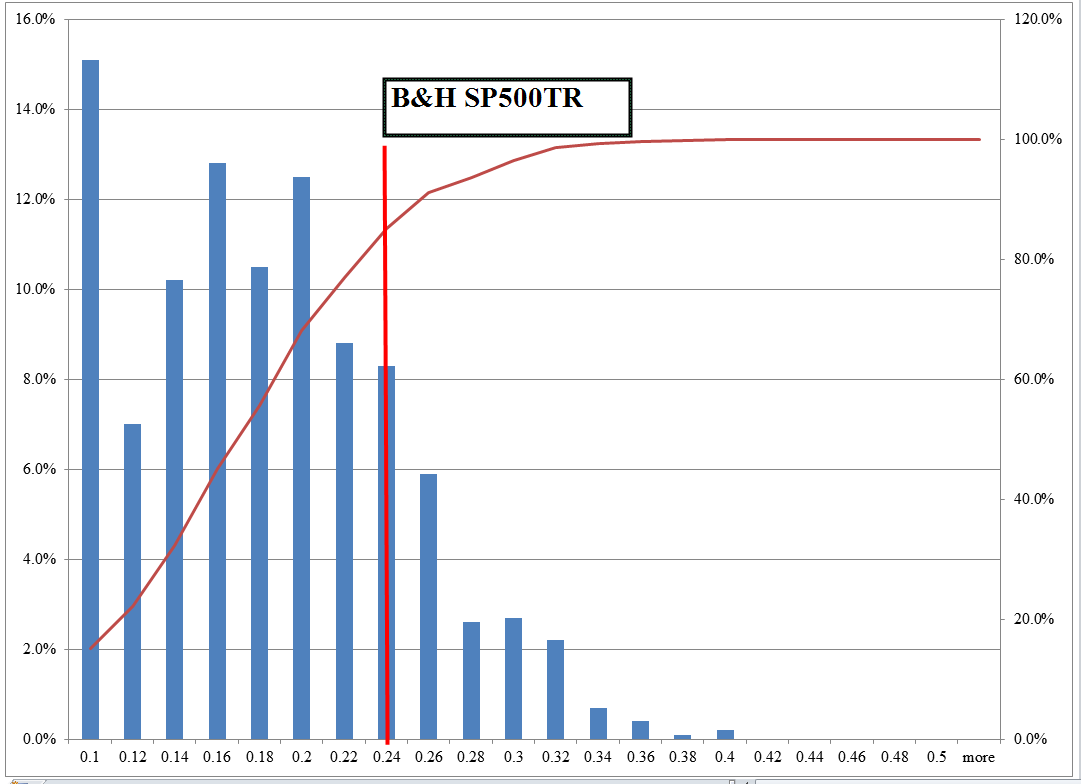
Here are the results from a 1000 “Random Tactical Asset Allocation” models:
CAGR
The results are hypothetical results and are NOT an indicator of future results and do NOT represent returns that any investor actually attained. Indexes are unmanaged, do not reflect management or trading fees, and one cannot invest directly in an index. Additional information regarding the construction of these results is available upon request.
MaxDD
The results are hypothetical results and are NOT an indicator of future results and do NOT represent returns that any investor actually attained. Indexes are unmanaged, do not reflect management or trading fees, and one cannot invest directly in an index. Additional information regarding the construction of these results is available upon request.
Sharpe (RF=5%)
The results are hypothetical results and are NOT an indicator of future results and do NOT represent returns that any investor actually attained. Indexes are unmanaged, do not reflect management or trading fees, and one cannot invest directly in an index. Additional information regarding the construction of these results is available upon request.
Summary:
- Random tactical asset allocation models have a higher Sharpe than B&H 15% of the time. Sharpe ratios above .3 occur 4% of the time.
- Max drawdowns are lower 95% of the time. However, cutting MaxDD below 60% only happens 12% of the time.
- CAGRs are higher 4% of the time and never exceed 12% CAGR.
Be wary of tactical asset allocation model salesman pitching higher Sharpes, lower maximum drawdowns, and similar CAGRs.
Disclosures:
Performance figures contained herein are hypothetical, unaudited and prepared by Alpha Architect, LLC; hypothetical results are intended for illustrative purposes only.
Past performance is not indicative of future results, which may vary.
There is a risk of substantial loss associated with trading commodities, futures, options and other financial instruments. Before trading, investors should carefully consider their financial position and risk tolerance to determine if the proposed trading style is appropriate. Investors should realize that when trading futures, commodities and/or granting/writing options one could lose the full balance of their account. It is also possible to lose more than the initial deposit when trading futures and/or granting/writing options. All funds committed to such a trading strategy should be purely risk capital.
Hypothetical performance results (e.g., quantitative backtests) have many inherent limitations, some of which, but not all, are described herein. No representation is being made that any fund or account will or is likely to achieve profits or losses similar to those shown herein. In fact, there are frequently sharp differences between hypothetical performance results and the actual results subsequently realized by any particular trading program. One of the limitations of hypothetical performance results is that they are generally prepared with the benefit of hindsight. In addition, hypothetical trading does not involve financial risk, and no hypothetical trading record can completely account for the impact of financial risk in actual trading. For example, the ability to withstand losses or adhere to a particular trading program in spite of trading losses are material points which can adversely affect actual trading results. The hypothetical performance results contained herein represent the application of the quantitative models as currently in effect on the date first written above and there can be no assurance that the models will remain the same in the future or that an application of the current models in the future will produce similar results because the relevant market and economic conditions that prevailed during the hypothetical performance period will not necessarily recur. There are numerous other factors related to the markets in general or to the implementation of any specific trading program which cannot be fully accounted for in the preparation of hypothetical performance results, all of which can adversely affect actual trading results. Hypothetical performance results are presented for illustrative purposes only.
Indexes are unmanaged, do not reflect management or trading fees, and one cannot invest directly in an index.
There is no guarantee, express or implied, that long-term return and/or volatility targets will be achieved. Realized returns and/or volatility may come in higher or lower than expected.

About the Author: Wesley Gray, PhD
—
Important Disclosures
For informational and educational purposes only and should not be construed as specific investment, accounting, legal, or tax advice. Certain information is deemed to be reliable, but its accuracy and completeness cannot be guaranteed. Third party information may become outdated or otherwise superseded without notice. Neither the Securities and Exchange Commission (SEC) nor any other federal or state agency has approved, determined the accuracy, or confirmed the adequacy of this article.
The views and opinions expressed herein are those of the author and do not necessarily reflect the views of Alpha Architect, its affiliates or its employees. Our full disclosures are available here. Definitions of common statistics used in our analysis are available here (towards the bottom).
Join thousands of other readers and subscribe to our blog.