Pairs Trading: Performance of a Relative-Value Arbitrage Rule
- Evan Gatev, William N. Goetzmann, and K. Geert Rouwenhorst
- A version of the paper can be found here.
- Want a summary of academic papers with alpha? Check out our free Academic Alpha Database!
Abstract:
We test a Wall Street investment strategy, ‘‘pairs trading,’’ with daily data over 1962–2002. Stocks are matched into pairs with minimum distance between normalized historical prices. A simple trading rule yields average annualized excess returns of up to 11% for self-financing portfolios of pairs. The profits typically exceed conservative transaction-cost estimates. Bootstrap results suggest that the ‘‘pairs’’ effect differs from previously documented reversal profits. Robustness of the excess returns indicates that pairs trading profits from temporary mispricing of close substitutes. We link the profitability to the presence of a common factor in the returns, different from conventional risk measures.
Data Sources:
CRSP
Alpha Highlight:
Not a bad strategy:
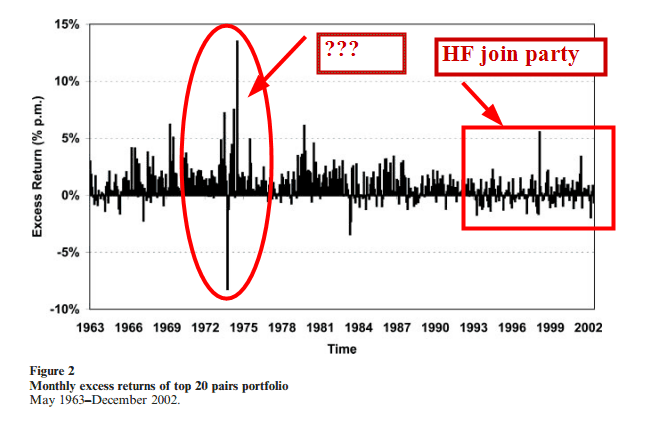
The results are hypothetical results and are NOT an indicator of future results and do NOT represent returns that any investor actually attained. Indexes are unmanaged, do not reflect management or trading fees, and one cannot invest directly in an index. Additional information regarding the construction of these results is available upon request.
Cumulative return chart to die for:
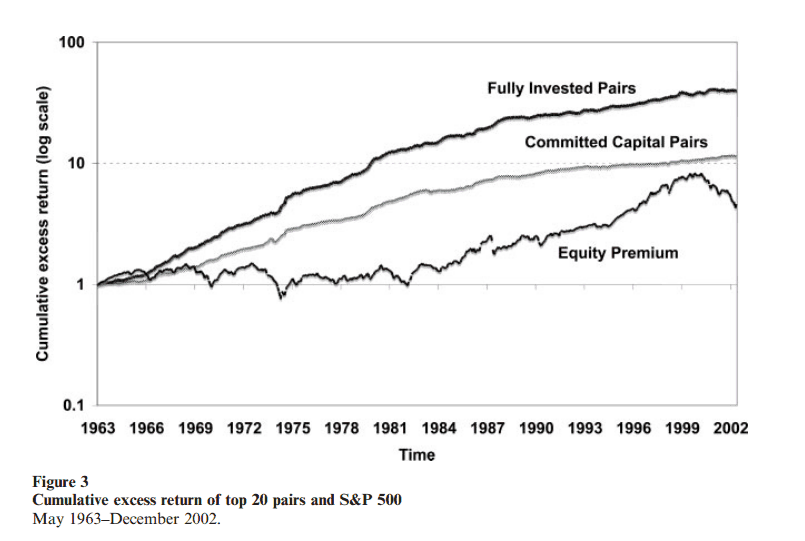
The results are hypothetical results and are NOT an indicator of future results and do NOT represent returns that any investor actually attained. Indexes are unmanaged, do not reflect management or trading fees, and one cannot invest directly in an index. Additional information regarding the construction of these results is available upon request.
Strategy Summary:
- Compute a daily price series (total return, including dividends) for each stock over a 12-month period.
- Form the “pair” for stock A by finding stock B (out of all stocks) that minimizes the sum of squared deviations between the two normalized price series.
- Pick the top 20 best “pairs” at the end of each month.
- Those that have the smallest sum of squared deviations over the past 12 months.
- These will be traded together for 6 months.
- Open the trading when prices diverge by more than 2 standard deviations, estimated during the pairs formation period.
- Short the stock which price series is now higher, and buy the stock whose price series is now lower.
- Unwind the position at the next crossing of the prices, or at the end of 6 months.
- Repeat each month, adding another 20 pairs to the trading strategy.
- Make money!
Commentary:
- Returns appear to be robust to trading costs.
- Contrarian strategy! Buy the stock whose price is now lower, and short the stock whose price is now higher.
- Figure 3 shows how this strategy appears to decrease volatility as opposed to simply investing in the SP500.
- Arbitrage-like strategies always look easy on paper, but the devil is in the details. Every multi-strat hedge fund worth their salt is doing a leveraged variation of this trade in one form or the other–what happens when there is a liquidity event?

About the Author: Wesley Gray, PhD
—
Important Disclosures
For informational and educational purposes only and should not be construed as specific investment, accounting, legal, or tax advice. Certain information is deemed to be reliable, but its accuracy and completeness cannot be guaranteed. Third party information may become outdated or otherwise superseded without notice. Neither the Securities and Exchange Commission (SEC) nor any other federal or state agency has approved, determined the accuracy, or confirmed the adequacy of this article.
The views and opinions expressed herein are those of the author and do not necessarily reflect the views of Alpha Architect, its affiliates or its employees. Our full disclosures are available here. Definitions of common statistics used in our analysis are available here (towards the bottom).
Join thousands of other readers and subscribe to our blog.