Asset Pricing in the Dark: The Cross Section of OTC Stocks
- Andrew Ang, Assaf A. Shtauber, and Paul C. Tetlock
- A version of the paper can be found here.
- Want a summary of academic papers with alpha? Check out our free Academic Alpha Database!
Abstract:
Over-the-counter (OTC) stocks are far less liquid, disclose less information, and exhibit lower institutional holdings than listed stocks. We exploit these different market conditions to test theories of cross-sectional return premiums. Compared to premiums in listed markets, the OTC illiquidity premium is several times higher, the size, value, and volatility premiums are similar, and the momentum premium is three times lower. The OTC illiquidity, size, value, and volatility premiums are largest among stocks held predominantly by retail investors and those not disclosing financial information. Theories of differences in investors’ opinions and limits on short sales help explain these return premiums.
Data Sources:
6,668 OTC Bulletin Board (OTCBB) or OTC LINK (Pink Sheets) from 1977 to 2008. Data from MarketQA (a Thomson Reuters product).
Alpha Highlight:
Table 4 Panel B lists the alpha for each of the cross-sectional factors for OTC firms (Value has a monthly CAPM value alpha of 2.88%).
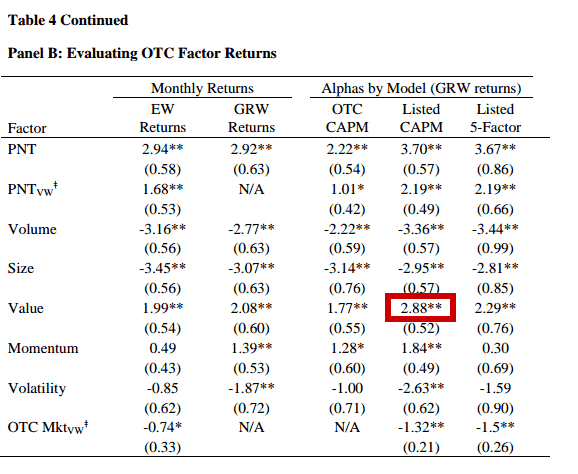
The results are hypothetical results and are NOT an indicator of future results and do NOT represent returns that any investor actually attained. Indexes are unmanaged, do not reflect management or trading fees, and one cannot invest directly in an index. Additional information regarding the construction of these results is available upon request.
Panel D show results for similar firms that are listed on exchanges. The value premium is only 1.40% per month, or roughly half the premium associated with OTC securities.
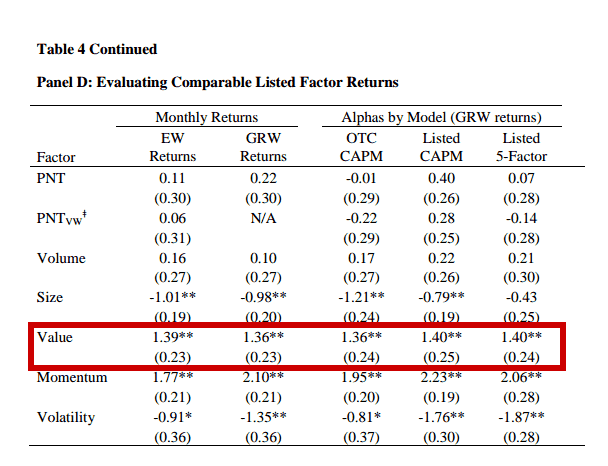
The results are hypothetical results and are NOT an indicator of future results and do NOT represent returns that any investor actually attained. Indexes are unmanaged, do not reflect management or trading fees, and one cannot invest directly in an index. Additional information regarding the construction of these results is available upon request.
Strategy Summary:
- Examine market data for 6,668 OTC firms from 1977 through 2008 (US common stocks traded in the OTCBB and PS markets).
- Paper examines the differences between OTC and exchange listed stocks:
- The return premium for illiquid stocks is much higher in OTC markets than in listed markets.
- Main liquidity measure is proportion of non-traded days (PNT).
- An OTC illiquidity factor has an annual Sharpe ratio of 0.91, whereas the comparable listed illiquidity factor has a Sharpe ratio of just 0.14.
- Return premiums for size, value, and volatility are similarly large in OTC markets while the return premium for momentum is considerably smaller and less robust in OTC markets.
- Most of the returns are driven by the short leg (where it is costly to short OTC stocks).
- Returns when sorting on volume, volatility, market capitalization, and M/B are larger for stocks with higher overconfidence and fewer disclosures.
- Paper uses a stock’s institutional ownership as an inverse measure of investor overconfidence. The return premiums for PNT, volume, volatility, value, and size are 1.0% to 4.4% per month larger in OTC stocks not held by institutions.
- The return premium for illiquid stocks is much higher in OTC markets than in listed markets.
- Regulatory changes to disclosure requorements:
- After June 2000, firms quoted on the OTCBB must have at least 100 shareholders, file annual reports, hold annual shareholder meetings, and meet other governance requirements, but these disclosure requirements do not apply to PS firms.
- Only 26% of OTC stocks are held by institutions, while 71% of comparable listed stocks are held by institutions.
Commentary:
- Interesting paper with new data source.
- May make sense to focus efforts on OTC stocks without institutional ownership, as the premiums for various factors are larger here.
- Although it may be very costly to short any of these firms.
- Value premium for OTC stocks seem 2x larger, but the authors seem to talk past this important empirical insight.
Ready for Pink Sheets?

About the Author: Wesley Gray, PhD
—
Important Disclosures
For informational and educational purposes only and should not be construed as specific investment, accounting, legal, or tax advice. Certain information is deemed to be reliable, but its accuracy and completeness cannot be guaranteed. Third party information may become outdated or otherwise superseded without notice. Neither the Securities and Exchange Commission (SEC) nor any other federal or state agency has approved, determined the accuracy, or confirmed the adequacy of this article.
The views and opinions expressed herein are those of the author and do not necessarily reflect the views of Alpha Architect, its affiliates or its employees. Our full disclosures are available here. Definitions of common statistics used in our analysis are available here (towards the bottom).
Join thousands of other readers and subscribe to our blog.