It has been a long, cold winter on the East Coast. This has been very good for anyone long natural gas.
Below is a chart, as of February 26, for the April natural gas futures contract during 2014:
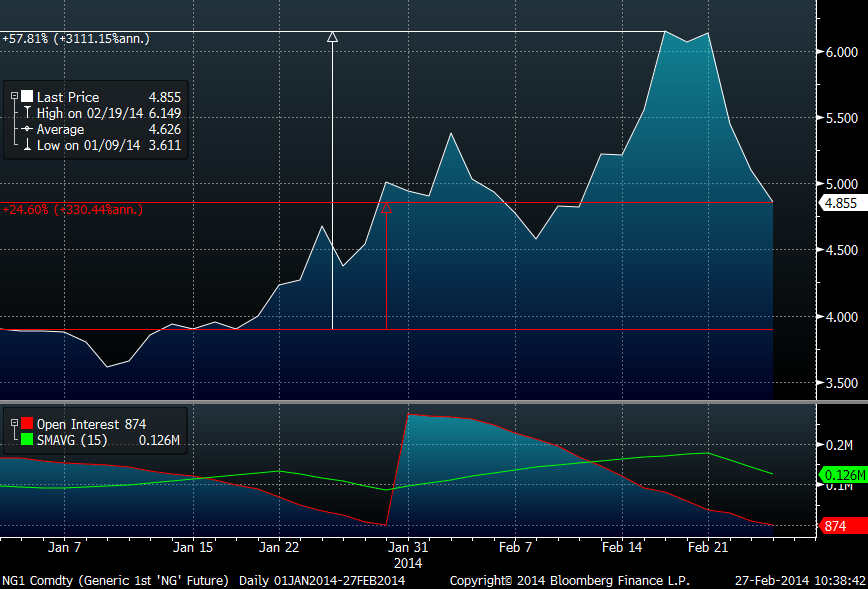
While it’s been a nice ride overall, prices have obviously fallen rapidly recently.
The February 26 version of the WSJ Journal included an article about this dramatic decline in natural gas prices, with the dramatic headline: “Futures Prices Decline 17% in Two Days as a Chill Sets in for Natural Gas.”
Within the article, Gelber & Associates was quoted as commenting in a research note:
The downward move started a chain reaction as long traders quickly exited their positions while they were still profitable.
So the traders wanted to get out while the trade was still profitable? Okay, makes sense.
Later in the same article was the following observation:
Analysts and forecasters said the underlying dynamics that have driven this year’s rally in natural-gas prices are unchanged: forecasts for extraordinarily cold weather through the final weeks of winter remain in place, suggesting continued strong demand for heating-related fuels.
So the underlying weather-related fundamentals have not changed in the market.
Wait, what?
How can it be that prices have dropped 17% with no material change in the fundamental outlook?
The article seems to suggest that the answer may have something to do with traders wanting to lock in their gains.
In “Mental Accounting, Loss Aversion, and Individual Stock Returns,” Nicholas Barberis and Ming Huang discuss mental accounting and how it can affect decision-making:
Numerous experimental studies suggest that when doing their mental accounting, people engage in narrow framing, that is, they often appear to pay attention to narrowly defined gains and losses…A loss that comes after prior gains is less painful than usual, because it is cushioned by those earlier gains. A loss that comes after other losses, however, is more painful than usual.
The paper includes a graph that demonstrates the concept:
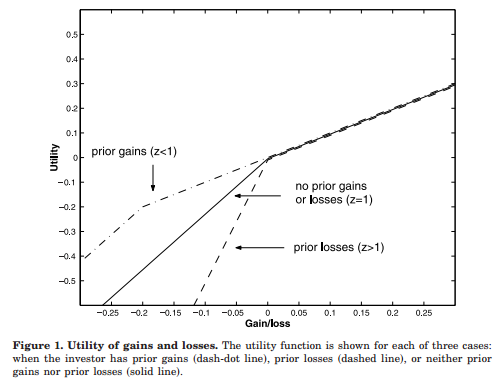
In the case of the natural gas trade, the trader’s utility function is represented by the dash-dot line. When the trader is profitable (z<1), the pain of any initial losses is low. The curve is relatively flat, due to the built-in gains.
As natural gas prices decline, however, the trader becomes more sensitive to potential losses that could occur if the price falls below his purchase price. The curve steepens significantly below where he is neutral on profitability. The trader says to himself:
Although the price has dropped, it only hurts a little, since I still have a gain. I know that if the price continues to fall, and I start to make losses, this trade is REALLY going to hurt, and I’ll experience much more regret. I’ll sell now.
In this case, it may be that the natural gas traders are ignoring price on an absolute basis, and instead, are focused on price relative to what they paid for the natural gas future. If this is true, then we may be seeing a real-world demonstration of the cascading effects of mental accounting by traders in the natural gas markets.

About the Author: David Foulke
—
Important Disclosures
For informational and educational purposes only and should not be construed as specific investment, accounting, legal, or tax advice. Certain information is deemed to be reliable, but its accuracy and completeness cannot be guaranteed. Third party information may become outdated or otherwise superseded without notice. Neither the Securities and Exchange Commission (SEC) nor any other federal or state agency has approved, determined the accuracy, or confirmed the adequacy of this article.
The views and opinions expressed herein are those of the author and do not necessarily reflect the views of Alpha Architect, its affiliates or its employees. Our full disclosures are available here. Definitions of common statistics used in our analysis are available here (towards the bottom).
Join thousands of other readers and subscribe to our blog.