Industry Window Dressing
- Huaizhi Chen, Lauren Cohen, Dong Lou
- A version of the paper can be found here.
- Want a summary of academic papers with alpha? Check out our Academic Research Recap Category!
Abstract:
We explore a new mechanism through which investors take correlated shortcuts. Specifically, we exploit a regulatory provision governing firm classification into industries: A firm’s industry classification is determined by the segment that has the majority of sales. We find strong evidence that investors overly rely on this primary industry classification. Firms just above the industry classification cutoff have significantly higher betas with respect to, as well as more sector mutual fund holdings and analyst coverage from, that industry, compared to nearly identical firms just below the cutoff. We then show that managers undertake specific actions to exploit investor shortcuts. Firms around the discontinuity point of 50% sales are significantly more likely to have just over 50% of sales from a “favorable” industry. Further, these firms just over the cutoff have significantly lower profit margins and inventory growth compared to other firms in the same industries, consistent with these firms slashing prices to increase sales. These same firms, however, do not exhibit different behaviors in any other aspect of their business (e.g., CapEx or R&D), suggesting that it is not a firm-wide shift of focus. Last, firms garner tangible benefits from switching into favorable industries, such as engaging in significantly more SEOs and stock-financed M&As.
Alpha Highlight:
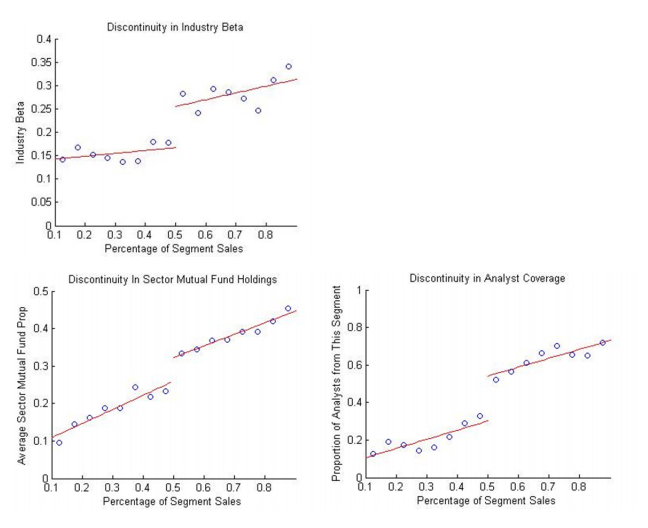
A company becomes “associated” with an industry if 50% of its sales are derived from a specific segment. So a firm with 51% of revenues derived from car-manufacturing, and 49% derived from basket-weaving operations will be classified as a full-fledged car manufacturer. The nugget the authors uncover is that sector betas, sector mutual fund managers, and sector-focused sell-side analysts are heavily influenced by SIC classification.
The chart below shows that the “50 percent cutoff” has a huge influence on market behavior. For example, a firm with 51% in healthcare revenue and a firm with 100% healthcare sales will be treated similarly.
Possible trading idea:
Identify a firm ABC which is 51% in healthcare; 49% in Aerospace. If the healthcare sector blows out, its likely that ABC will blow up with it–even if aerospace may have been doing great. You can imagine potential trading strategies around this concept.
Go get ’em prop desks!

About the Author: Wesley Gray, PhD
—
Important Disclosures
For informational and educational purposes only and should not be construed as specific investment, accounting, legal, or tax advice. Certain information is deemed to be reliable, but its accuracy and completeness cannot be guaranteed. Third party information may become outdated or otherwise superseded without notice. Neither the Securities and Exchange Commission (SEC) nor any other federal or state agency has approved, determined the accuracy, or confirmed the adequacy of this article.
The views and opinions expressed herein are those of the author and do not necessarily reflect the views of Alpha Architect, its affiliates or its employees. Our full disclosures are available here. Definitions of common statistics used in our analysis are available here (towards the bottom).
Join thousands of other readers and subscribe to our blog.