We know that valuation metrics such as the CAPE, or Shiller P/E, ratio are correlated with long-term returns (notice we didn’t say “predict” long-term returns–that is debatable).
Here is a brief background on the measure:
Here are some recent articles on the subject:
- http://www.beyondproxy.com/shiller-pe/
- http://mebfaber.com/2014/06/10/if-you-used-valuation-you-would-be-out-of-stocks-since-1995/
- http://hussmanfunds.com/wmc/wmc140310.htm
- http://gestaltu.com/2014/01/valuation-based-equity-market-forecast-q3-2013-update.html
Some of our own ink on the subject:
- http://alphaarchitect.com/blog/2013/05/20/are-market-valuations-too-high/
- http://alphaarchitect.com/blog/2013/04/12/are-stocks-expensive-yes-but/
- http://alphaarchitect.com/blog/2012/12/13/projected-15-year-sp-500-returns/
There is a consistent drumbeat these days of “Valuations are too high; future returns will be poor.” I can’t say I disagree with the general sentiment, but Philosophical Economics has jumped into the debate and reminded all of us that correlation is not causation.
A few recent articles from “Jesse Livermore” are posted below:
- http://philosophicaleconomics.wordpress.com/2014/06/12/critique/
- https://philosophicaleconomics.wordpress.com/2014/06/08/sixpercent/
- https://philosophicaleconomics.wordpress.com/2014/05/31/profit-margins-accounting-for-the-effects-of-wealth-redistribution/
All of these writings are educational and certainly thought-provoking. That said, we wanted to answer a different question:
How does one utilize valuation metrics information in the real-world?
If the P/E ratio on the market is in the top 5%, do we simply sit on our hands for 5, 10, or 15 years waiting for “the bubble to break?” Example: Internet Bubble. Meb makes a solid argument that maybe we should, but I doubt any human being could actually follow that model.
Or what if the P/E ratio is in the bottom 5%–we believe returns over the next 10 years will likely be favorable—but what about the digestibility of the 50% drawdown we endure when the market P/E goes from 10 to 5? Example: Great Depression. Cash might be king when your worried about paying for your next meal!
The goal of this research piece is to identify a simple and PRACTICAL way to integrate market valuations into a market-timing framework.
We test how valuation signals compare to, and interact with, another popular timing device, the moving average (MA) signal.
- For the MA signals, we use monthly (1,12) MA rule on the total return for the SP500.
- If the price for last month is above the past 12 months average, stay in the market, otherwise, invest in the risk-free rate.
- For the valuation signal, we examine CAPE (Shiller’s Cyclically Adjusted PE ratio).
- For robustness, we also test the Dividend Yield, Default Yield Spread, and GNP/Marketcap.
Summary Findings:
- Valuation-based trading rules add no value and underperform the simple (1,12) MA rule.
- Various combinations of MA and valuation rules cannot improve results relative to the (1,12) MA rule.
- MA rules starting in the late 1930’s are also questionable, albeit, at just about every other starting point they look more attractive. We start in 1938 because we need to burn 10 years of data establishing a “benchmark” valuation level (our data starts in 1927).
- The data suggest that market valuations have limited PRACTICAL use.
Strategy Background
- The valuation rules are the 4 following measures: (Higher–>Cheaper; Lower–>More Expensive)
- 1/CAPE = Inverse of Shiller’s Cyclically Adjusted PE ratio.
- Dividend Yield = Total Dividends for SP500 over the past 12 months divided by the SP500 closing price.
- Default Yield Spread = BAA Yield – AAA Yield.
- GNP/Marketcap = GNP of U.S. divided by the total market capitalization of U.S. Equity Markets.
- At the end of every month, we compute the (1,12) MA rule by comparing the previous month’s price series for the SP500 to the average over the past 12 months.
- If last month’s price is above the past 12 month average, invest in the SP500.
- If last month’s price is below the past 12 month average, buy U.S. Treasury Bills (RF).
- For the valuation measures, we compute the percentile for the last month’s valuation measure relative to the past 10 years of each valuation measure.
- Example: if the dividend yield was 3.2% last month, we compare this to the past 120 months and see what percentile this falls into.
- If 3.2% is below the x-percentile (e.g., 5th percentile) for dividend yield, valuations are too high, so invest in RF.
- If 3.2% is above the x-percentile (e.g., 5th percentile) for dividend yield, valuations are fine, so invest in stocks.
- Example: if the dividend yield was 3.2% last month, we compare this to the past 120 months and see what percentile this falls into.
- For the combination of MA rules and valuation rules we do the following:
- If valuation rule says stocks are really cheap –> invest in the market
- If valuation rule says stocks are really expensive –> invest in risk-free
- Otherwise, default to the MA rule.
- Labeled “M&V_x%”
- This strategy is effectively an MA rule with a “valuation override” component.
- SP500 = S&P 500 Total Return Index
- LTR = 10 year Treasury Total Return
Statistics Summary
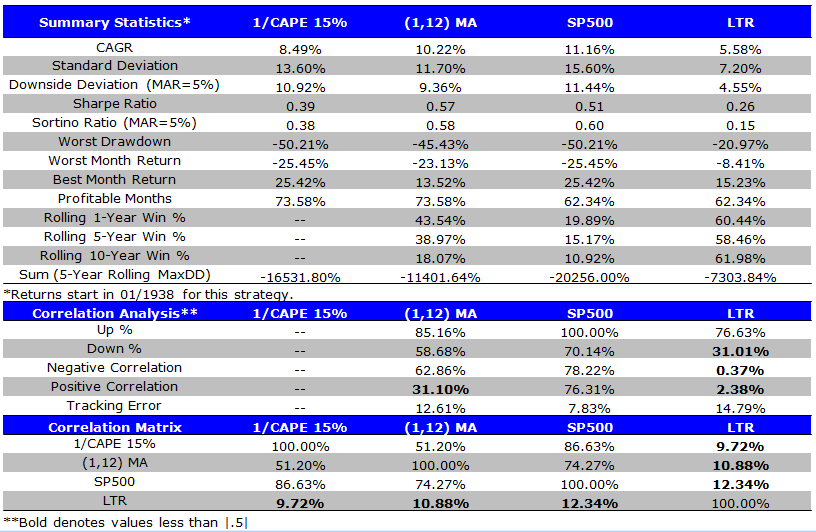
One on One (Full Sample): MA vs. 1/CAPE (15 percentile expensive cutoff)
- 1/1/1938 – 4/30/2014
- 1/CAPE signals into RF if in bottom 15% (expensive)
- (1,12) MA outperforms 1/CAPE; tied with buy and hold.
The results are hypothetical results and are NOT an indicator of future results and do NOT represent returns that any investor actually attained. Indexes are unmanaged, do not reflect management or trading fees, and one cannot invest directly in an index. Additional information regarding the construction of these results is available upon request.
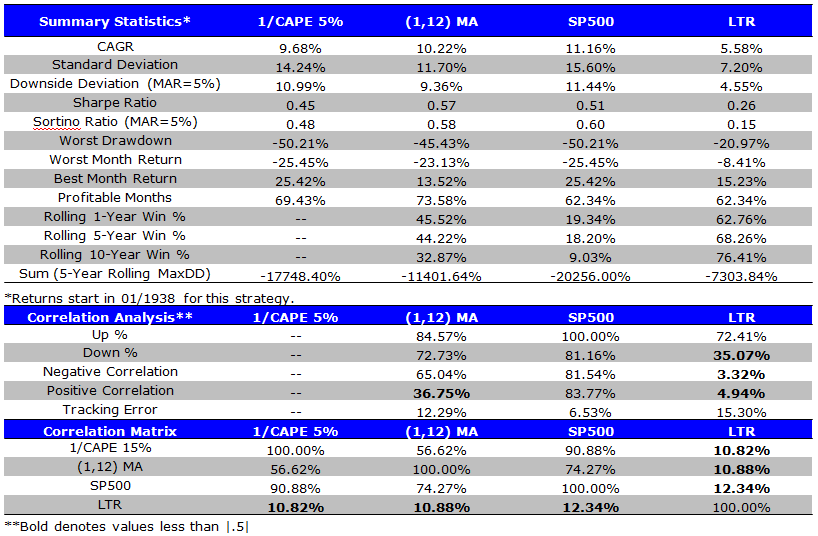
One on One (Full Sample): MA vs. 1/CAPE (5 percentile expensive cutoff)
- 1/1/1938 – 4/30/2014
- 1/CAPE signals into RF if in bottom 5%
- (1,12) MA outperforms 1/CAPE; tied with buy and hold.
The results are hypothetical results and are NOT an indicator of future results and do NOT represent returns that any investor actually attained. Indexes are unmanaged, do not reflect management or trading fees, and one cannot invest directly in an index. Additional information regarding the construction of these results is available upon request.
One on One (First Half): MA vs. 1/CAPE (15 percentile expensive cutoff)
- 1/1/1938 – 12/31/1959
- 1/CAPE signals into RF if in bottom 15%
- 1/CAPE signal works better than MA; worse than buy and hold.
The results are hypothetical results and are NOT an indicator of future results and do NOT represent returns that any investor actually attained. Indexes are unmanaged, do not reflect management or trading fees, and one cannot invest directly in an index. Additional information regarding the construction of these results is available upon request.
One on One (First Half): MA vs. 1/CAPE (5 percentile expensive cutoff)
- 1/1/1938 – 12/31/1959
- 1/CAPE signals into RF if in bottom 5%
- 1/CAPE signal works better than MA; worse than buy and hold.
The results are hypothetical results and are NOT an indicator of future results and do NOT represent returns that any investor actually attained. Indexes are unmanaged, do not reflect management or trading fees, and one cannot invest directly in an index. Additional information regarding the construction of these results is available upon request.
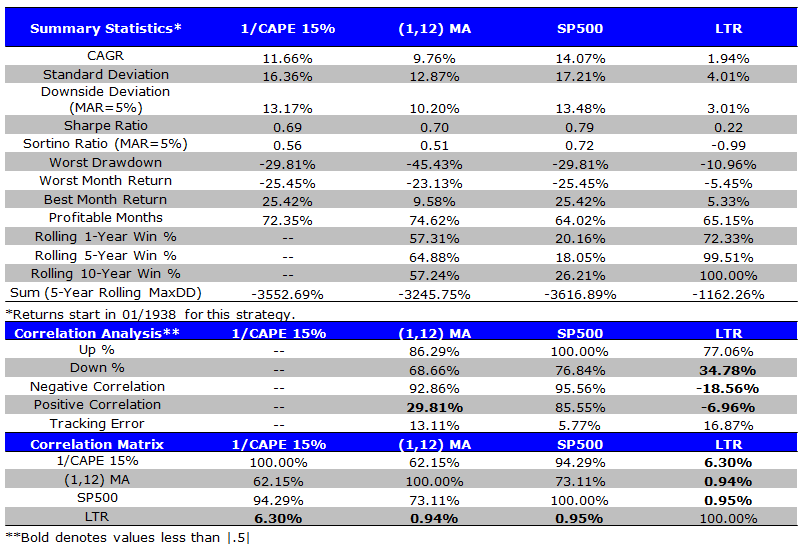
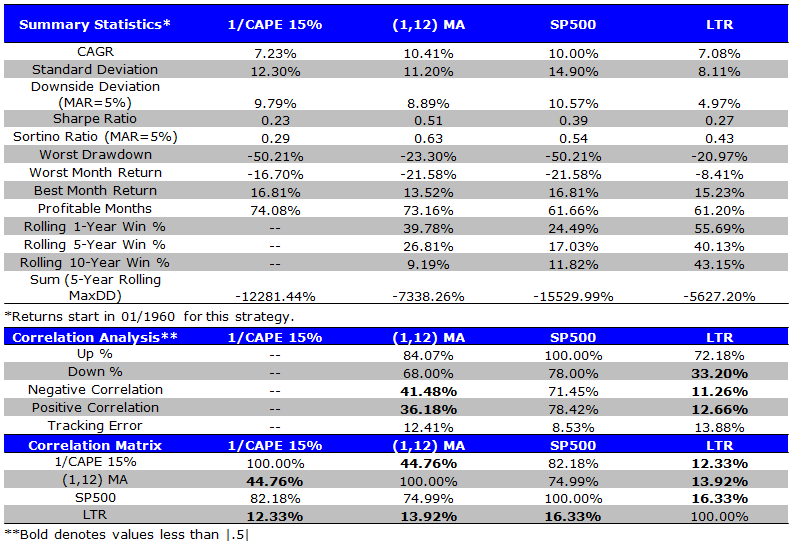
One on One (Second Half): MA vs. 1/CAPE (15 percentile expensive cutoff)
- 1/1/1960 – 4/30/2014
- 1/CAPE signals into RF if in bottom 15%
- (1,12) MA signal works better than CAPE and buy and hold.
The results are hypothetical results and are NOT an indicator of future results and do NOT represent returns that any investor actually attained. Indexes are unmanaged, do not reflect management or trading fees, and one cannot invest directly in an index. Additional information regarding the construction of these results is available upon request.
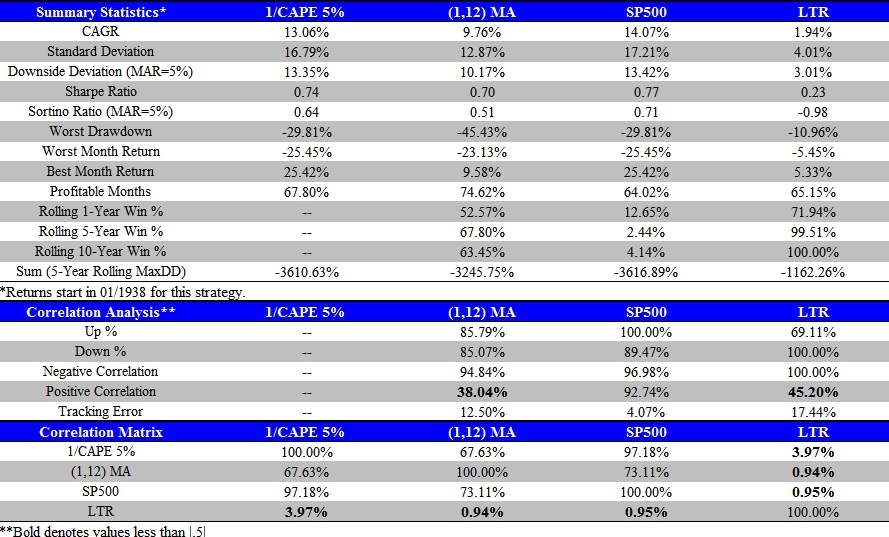
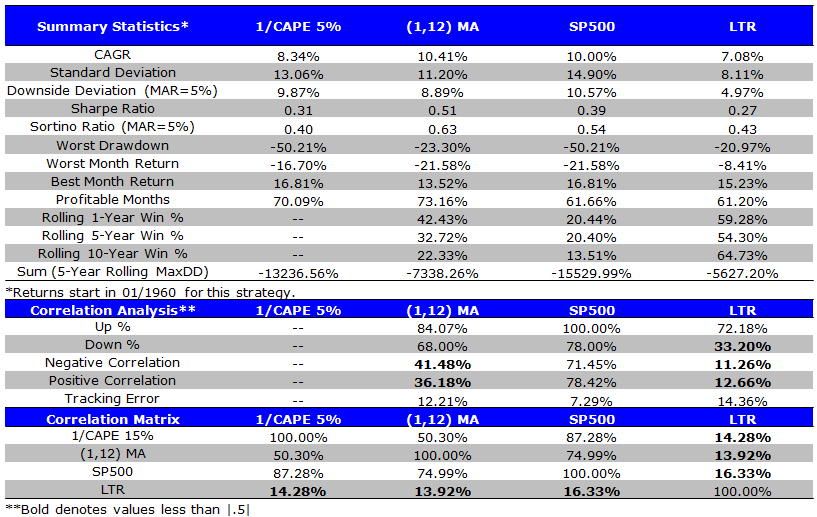
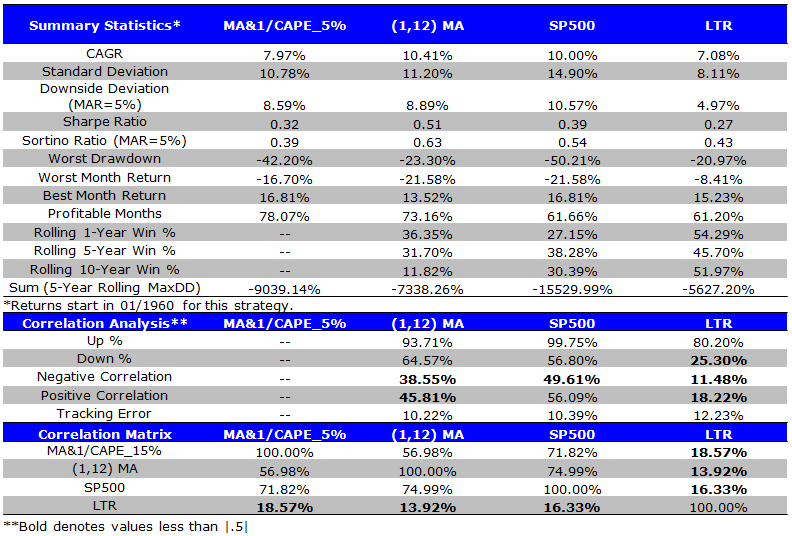
One on One (Second Half): MA vs. 1/CAPE (5 percentile expensive cutoff)
- 1/1/1960 – 4/30/2014
- 1/CAPE signals into RF if in bottom 5%
- (1,12) MA signal works better than CAPE and buy and hold.
The results are hypothetical results and are NOT an indicator of future results and do NOT represent returns that any investor actually attained. Indexes are unmanaged, do not reflect management or trading fees, and one cannot invest directly in an index. Additional information regarding the construction of these results is available upon request.
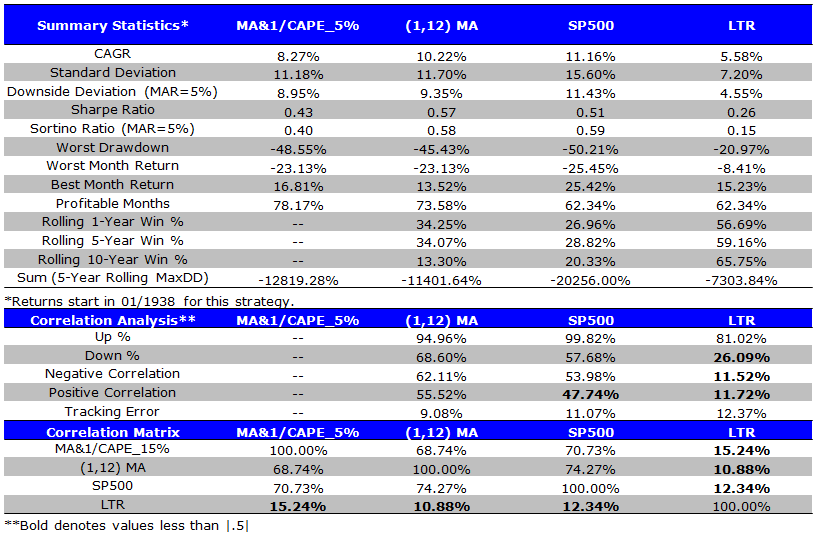
Teaming Up (Full Sample): MA and 1/CAPE (5 percentile expensive cutoff)
- 1/1/1938 – 4/30/2014
- 1/CAPE signals into RF if in bottom 5%
- 1/CAPE signals into stocks if in top 5%
- Otherwise, use MA rule
- (1,12) MA signal works; CAPE integration does not.
The results are hypothetical results and are NOT an indicator of future results and do NOT represent returns that any investor actually attained. Indexes are unmanaged, do not reflect management or trading fees, and one cannot invest directly in an index. Additional information regarding the construction of these results is available upon request.
Teaming Up (First Half): MA and 1/CAPE (5 percentile expensive cutoff)
- 1/1/1938 – 12/31/1959
- 1/CAPE signals into RF if in bottom 5%
- 1/CAPE signals into stocks if in top 5%
- Otherwise, use MA rule
- CAPE is ineffective; MA is ineffective.
The results are hypothetical results and are NOT an indicator of future results and do NOT represent returns that any investor actually attained. Indexes are unmanaged, do not reflect management or trading fees, and one cannot invest directly in an index. Additional information regarding the construction of these results is available upon request.
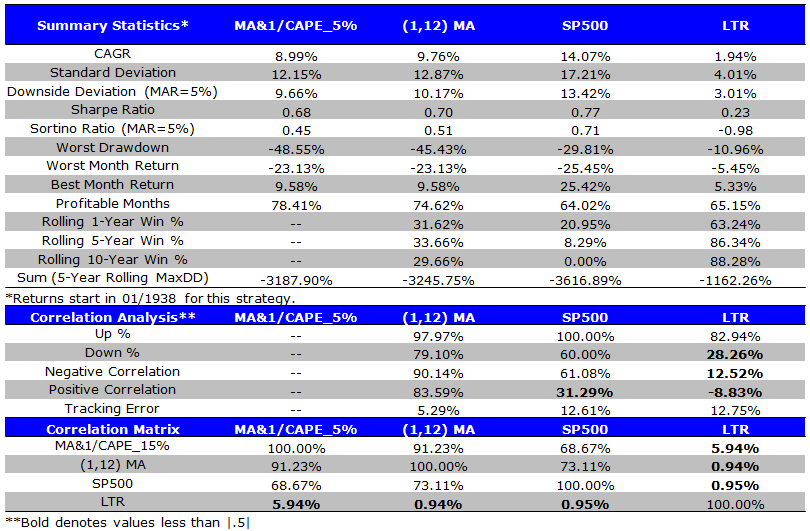
Teaming Up (Second Half): MA and 1/CAPE (5 percentile expensive cutoff)
- 1/1/1960 – 4/30/2014
- 1/CAPE signals into RF if in bottom 5%
- 1/CAPE signals into stocks if in top 5%
- Otherwise, use MA rule
- (1,12) MA signal works; CAPE integration does not.
The results are hypothetical results and are NOT an indicator of future results and do NOT represent returns that any investor actually attained. Indexes are unmanaged, do not reflect management or trading fees, and one cannot invest directly in an index. Additional information regarding the construction of these results is available upon request.
Valuation Metric Horse race: MA and 1/CAPE (5 percentile expensive cutoff)
- 1/1/1960 – 4/30/2014 (sample where data is available for all measures)
- Each valuation signals into RF if in bottom 5%
- Dividend Yield, Default Yield, and GNP/Marketcap all work marginally better than CAPE.
- All valuation timing strategies underperform buy and hold and the MA strategy.
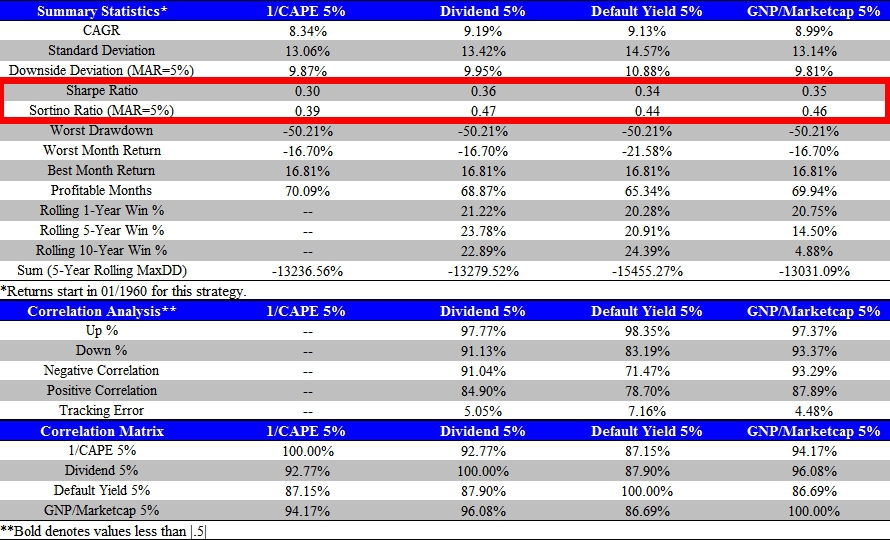
The results are hypothetical results and are NOT an indicator of future results and do NOT represent returns that any investor actually attained. Indexes are unmanaged, do not reflect management or trading fees, and one cannot invest directly in an index. Additional information regarding the construction of these results is available upon request.
Conclusion:
As a die hard value guy I want to believe there is a ***robust*** way to use valuations in a practical way for market timing. I haven’t seen anything out there that is convincing.
Please send ideas–I want to be convinced (Yes, I’m suffering from confirmation bias)!

About the Author: Wesley Gray, PhD
—
Important Disclosures
For informational and educational purposes only and should not be construed as specific investment, accounting, legal, or tax advice. Certain information is deemed to be reliable, but its accuracy and completeness cannot be guaranteed. Third party information may become outdated or otherwise superseded without notice. Neither the Securities and Exchange Commission (SEC) nor any other federal or state agency has approved, determined the accuracy, or confirmed the adequacy of this article.
The views and opinions expressed herein are those of the author and do not necessarily reflect the views of Alpha Architect, its affiliates or its employees. Our full disclosures are available here. Definitions of common statistics used in our analysis are available here (towards the bottom).
Join thousands of other readers and subscribe to our blog.