Been thinking a lot about risk and return these days.
Even started skimming through Fama’s old book “Foundations of Finance.” The book is available for free:
Fama has some interesting charts and ideas regarding the statistics of monthly stock returns.
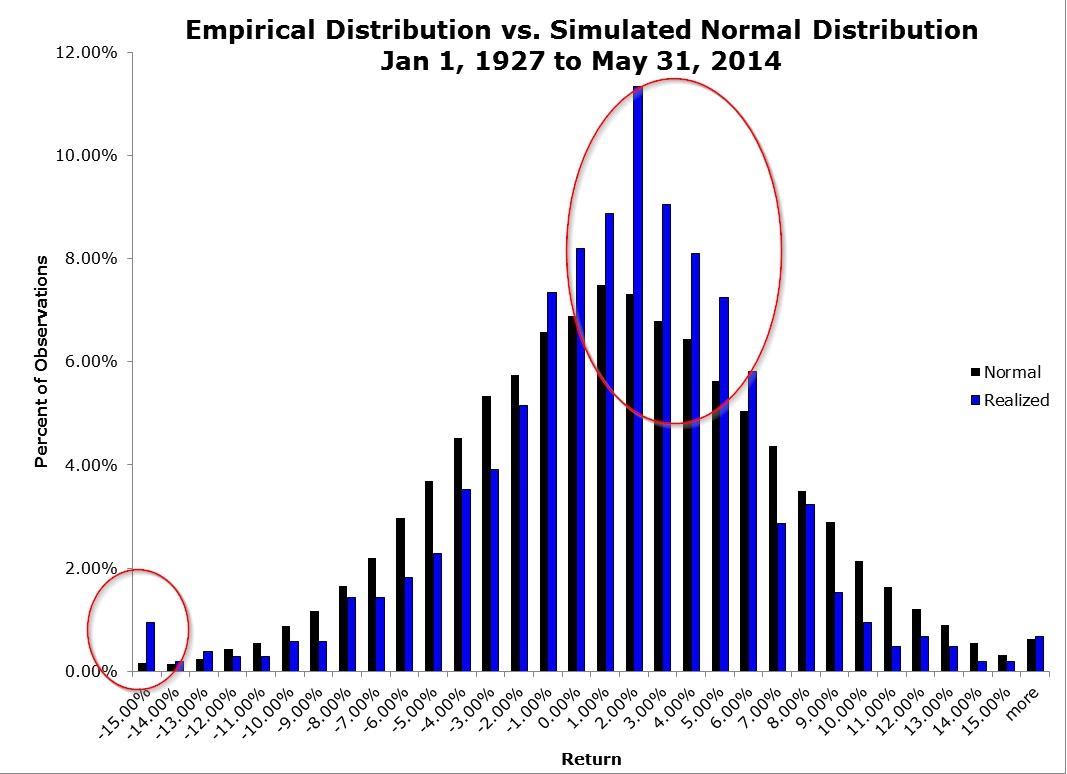
I went ahead and build a simple chart of the realized monthly return distribution for the S&P 500 from Jan 1927 through May 2014. (blue)
I also ran a simulation for 15,000 trials that are normally distributed with a mean of 94bps and a standard deviation of 5.53% (the actual values for monthly returns during the sample period).
The results are hypothetical results and are NOT an indicator of future results and do NOT represent returns that any investor actually attained. Indexes are unmanaged, do not reflect management or trading fees, and one cannot invest directly in an index. Additional information regarding the construction of these results is available upon request.
Typically, we’ve heard that monthly stock returns have “fat tails.” This statement is a bit misleading.
Based on the chart above the data provide the following conclusions:
- Realized stock returns have one fat tail (the low return tail).
- Realized stock returns are skewed to the right (negative skew).
To summarize, stock returns don’t necessarily have “fat tails,” rather, stock returns have one fat tail and negative skew…a bit different.
Does this jive with findings from others? The result surprised me a bit…

About the Author: Wesley Gray, PhD
—
Important Disclosures
For informational and educational purposes only and should not be construed as specific investment, accounting, legal, or tax advice. Certain information is deemed to be reliable, but its accuracy and completeness cannot be guaranteed. Third party information may become outdated or otherwise superseded without notice. Neither the Securities and Exchange Commission (SEC) nor any other federal or state agency has approved, determined the accuracy, or confirmed the adequacy of this article.
The views and opinions expressed herein are those of the author and do not necessarily reflect the views of Alpha Architect, its affiliates or its employees. Our full disclosures are available here. Definitions of common statistics used in our analysis are available here (towards the bottom).
Join thousands of other readers and subscribe to our blog.