Exploiting Factor Autocorrelation to Improve Risk Adjusted Returns
- K Oversby
- A version of the paper can be found here.
- Want a summary of academic papers with alpha? Check out our Academic Research Recap Category!
Abstract:
The Fama-French three factor model is ubiquitous in modern finance. Returns are modeled as a linear combination of a market factor, a size factor and a book-to-market equity ratio (or “value”) factor. The success of this approach, since its introduction in 1992, has resulted in widespread adoption and a large body of related academic literature. The risk factors exhibit serial correlation at a monthly timeframe. This property is strongest in the value factor, perhaps due to its association with global funding liquidity risk. Using thirty years of Fama-French portfolio data, I show that autocorrelation of the value factor may be exploited to efficiently allocate capital into segments of the US stock market. The strategy outperforms the underlying portfolios on an absolute and risk adjusted basis.
Annual returns are 5% greater than the components and Sharpe Ratio is increased by 86%. The results are robust to different time periods and varying composition of underlying portfolios. Finally, I show that implementation costs are much smaller than the excess return and that the strategy is accessible to the individual investor.
Alpha Highlight:
This interesting paper “Exploiting Factor Autocorrelation to Improve Risk Adjusted Returns” caught our attention. We highlighted this paper a month ago via a paper summary, but decided to dig a little deeper.
The paper claims that by using HML to switch between small value and small momentum portfolios, the strategy can generate superior returns. We conducted our own backtesting by using data from the French website.
The first part of our study is the replication of the paper’s strategy; Second part is the robustness test; Third part is implementation discussion.
Data
Monthly returns from 01-1984 to 12-2013
- Value-weighted 6 Portfolios Formed on Size and Book-to-Market (2 x 3)
- Value-weighted 6 Portfolios Formed on Size and Momentum (2 x 3)
- Value-weighted 100 Portfolios Formed on Size and Book-to-Market (10 x 10)
- Value-weighted 25 Portfolios Formed on Size and Momentum (5 x 5)
- PDP, PRF total return series, 01-2006 to 12-2013, from Bloomberg
Strategy
According to the paper:
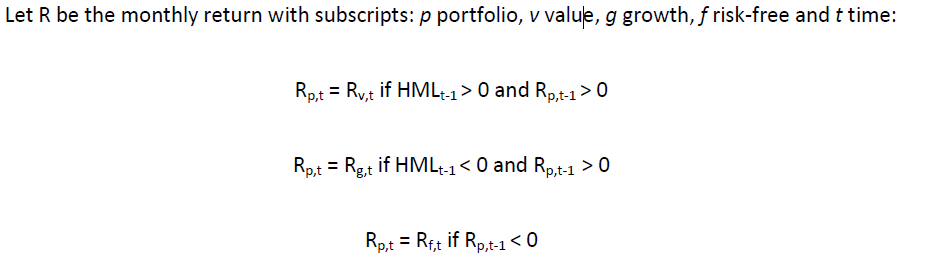
We follow the same strategy:
- IF last month’s HML > 0 and Return (value) > 0, then go into value (high b/m, small);
- IF last month’s HML < 0 and Return (MOM) > 0, then go into MOM (high mom, small);
- IF last month’s return < 0 then go into risk-free;
- IF none of above exists, then go into risk-free.
Replication
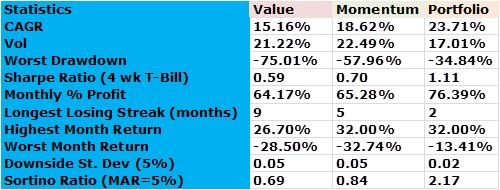
VW 2 x 3 size/bm and 2*3 size/mom. We selected SMALL value and SMALL momentum, using SMALL HML (small size high bm minus small size low bm) as the switching signal. The results from our analysis and the corresponding table from the paper are tabulated below:
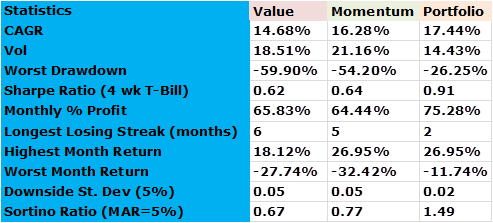
The results are hypothetical results and are NOT an indicator of future results and do NOT represent returns that any investor actually attained. Indexes are unmanaged, do not reflect management or trading fees, and one cannot invest directly in an index. Additional information regarding the construction of these results is available upon request.
Paper results
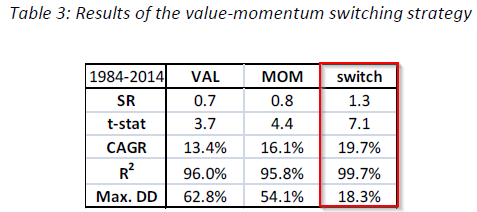
The results are hypothetical results and are NOT an indicator of future results and do NOT represent returns that any investor actually attained. Indexes are unmanaged, do not reflect management or trading fees, and one cannot invest directly in an index. Additional information regarding the construction of these results is available upon request.
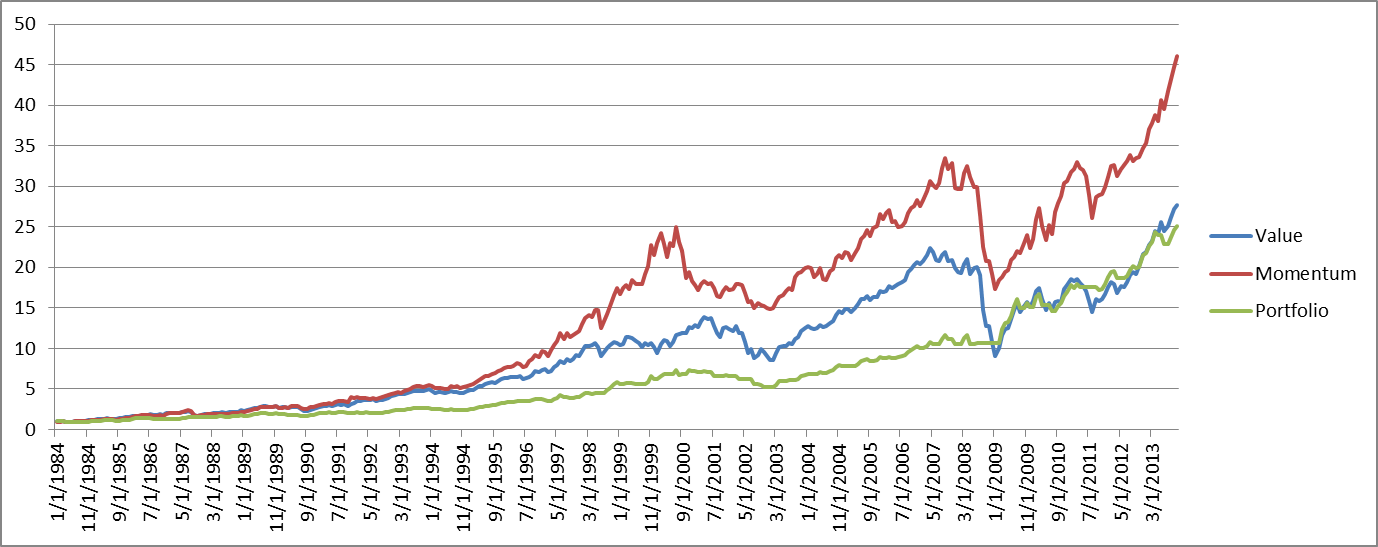
$1 Dollar Growth
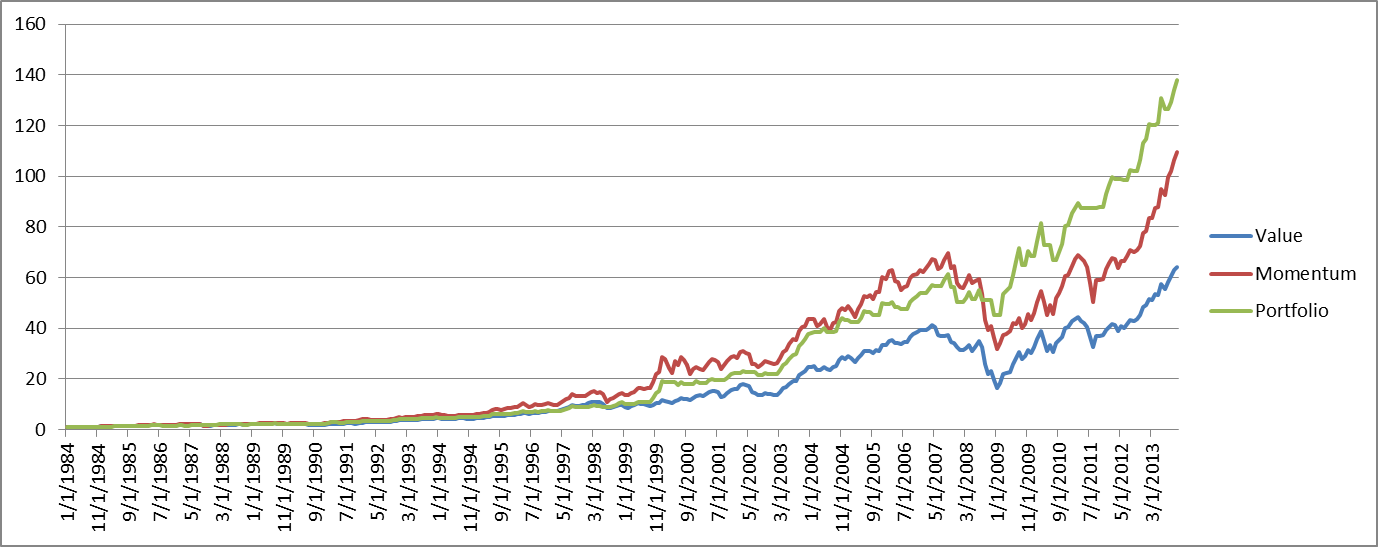
The results are hypothetical results and are NOT an indicator of future results and do NOT represent returns that any investor actually attained. Indexes are unmanaged, do not reflect management or trading fees, and one cannot invest directly in an index. Additional information regarding the construction of these results is available upon request.
Paper results
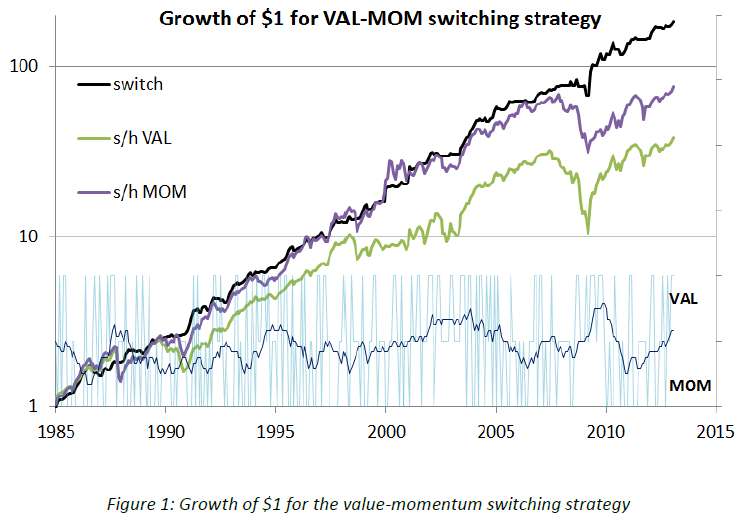
The results are hypothetical results and are NOT an indicator of future results and do NOT represent returns that any investor actually attained. Indexes are unmanaged, do not reflect management or trading fees, and one cannot invest directly in an index. Additional information regarding the construction of these results is available upon request.
The results are not as good as what is stated in the paper, but still good enough to warrant further study and investigation.
Robustness test
Large caps
We still use VW 2 x 3 size/bm and 2*3 size/mom. However, we selected BIG value and BIG momentum, using BIG HML (big size high bm minus big size low bm) as the switching signal. The results drop significantly relative to the results for small-caps. However, the portfolio benefits from combing value and momentum exposures are still valid: sortino ratios are much higher and drawdowns are vastly improved.

The results are hypothetical results and are NOT an indicator of future results and do NOT represent returns that any investor actually attained. Indexes are unmanaged, do not reflect management or trading fees, and one cannot invest directly in an index. Additional information regarding the construction of these results is available upon request.
$1 Dollar Growth
The results are hypothetical results and are NOT an indicator of future results and do NOT represent returns that any investor actually attained. Indexes are unmanaged, do not reflect management or trading fees, and one cannot invest directly in an index. Additional information regarding the construction of these results is available upon request.
More Refined Value and Momentum Portfolios
We use two extreme value and momentum portfolios: the value portfolio is the smallest value portfolio from the 10 x 10 size/bm portfolios cuts; the momentum portfolio is the smallest momentum portfolio from 5 x 5 size/mom cuts.
The results are hypothetical results and are NOT an indicator of future results and do NOT represent returns that any investor actually attained. Indexes are unmanaged, do not reflect management or trading fees, and one cannot invest directly in an index. Additional information regarding the construction of these results is available upon request.
$1 Dollar Growth

The results are hypothetical results and are NOT an indicator of future results and do NOT represent returns that any investor actually attained. Indexes are unmanaged, do not reflect management or trading fees, and one cannot invest directly in an index. Additional information regarding the construction of these results is available upon request.
Small and concentrated portfolios generate stronger results. Wes recently had a nice post on the size effect “Does the size effect exist? Probably” if you’d like to explore further.
Implementation?
Results for small caps look good. But there are many implementation challenges. If one uses the small momentum 5 x 5 split and small value 10 x 10 split, one can easily end up with liquidity issues due to the size of firms in the portfolios. By using 2 x 3 split, one can limit liquidity issues, but the results aren’t as strong.
Are there other ways we can implement this strategy?
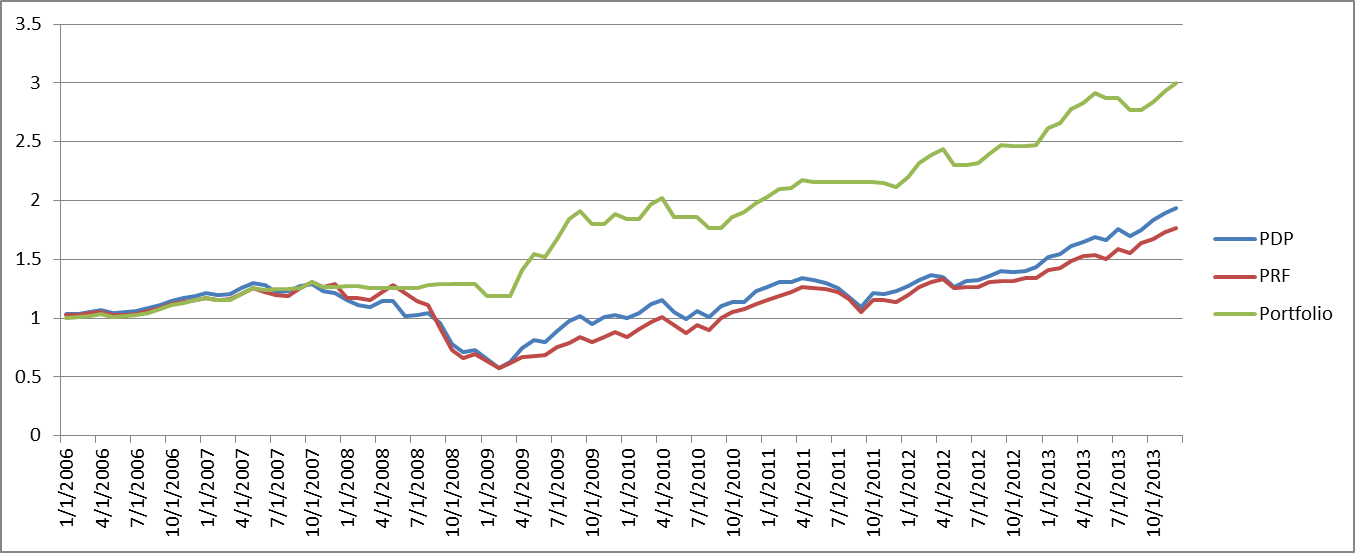
ETFs might be a good solution. Below we show the backtest results by using total returns of PDP (value) and PRF (momentum) from 01-2006 to 12-2013. “Portfolio” is the switch strategy between PDP and PRF based on 2 x 3 big HML signal.
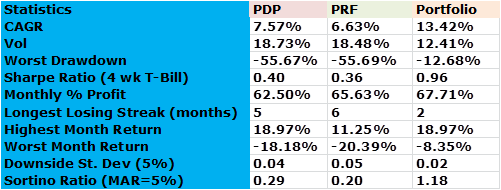
The results are hypothetical results and are NOT an indicator of future results and do NOT represent returns that any investor actually attained. Indexes are unmanaged, do not reflect management or trading fees, and one cannot invest directly in an index. Additional information regarding the construction of these results is available upon request.
$1 Dollar Growth
The results are hypothetical results and are NOT an indicator of future results and do NOT represent returns that any investor actually attained. Indexes are unmanaged, do not reflect management or trading fees, and one cannot invest directly in an index. Additional information regarding the construction of these results is available upon request.
The results are strong. That said, implementing this strategy could be a challenge for the non-professional or non-quant geek investor. Good luck!

About the Author: Wesley Gray, PhD
—
Important Disclosures
For informational and educational purposes only and should not be construed as specific investment, accounting, legal, or tax advice. Certain information is deemed to be reliable, but its accuracy and completeness cannot be guaranteed. Third party information may become outdated or otherwise superseded without notice. Neither the Securities and Exchange Commission (SEC) nor any other federal or state agency has approved, determined the accuracy, or confirmed the adequacy of this article.
The views and opinions expressed herein are those of the author and do not necessarily reflect the views of Alpha Architect, its affiliates or its employees. Our full disclosures are available here. Definitions of common statistics used in our analysis are available here (towards the bottom).
Join thousands of other readers and subscribe to our blog.