How crazy is current market action?
Not that crazy.
…and if you lived through 2008, definitely not that crazy.
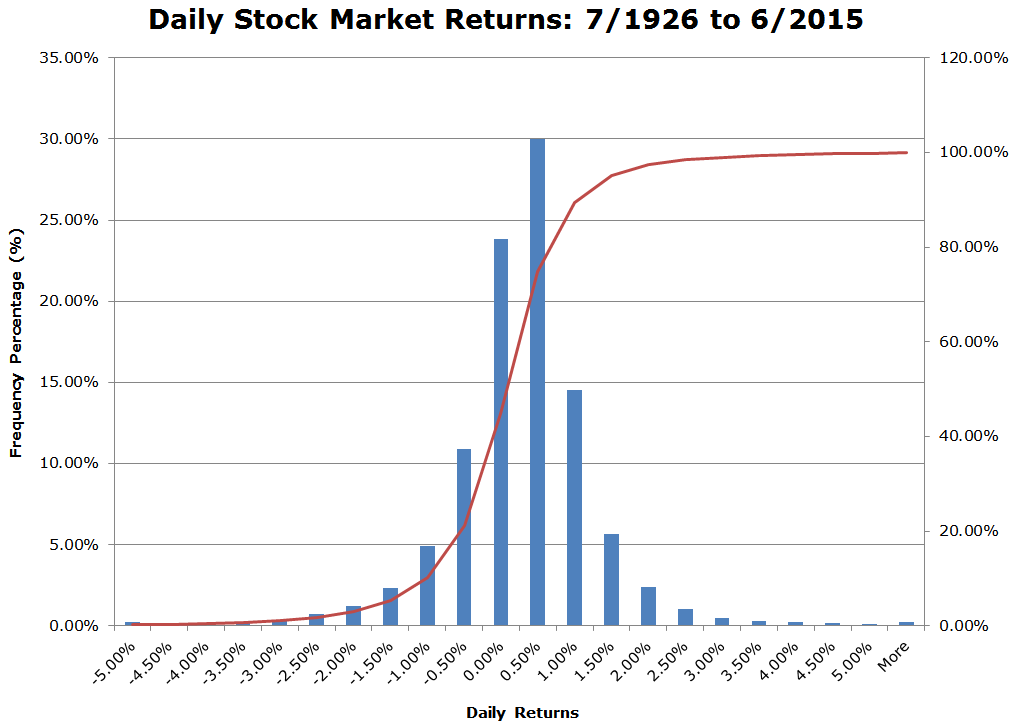
Seeing a -3%+ or a +3% observation is roughly a 1/100 event, or ~ 2.5 times a year. Obviously, return events are not independent and volatility tends to cluster, but the numbers above establish a basic starting point for discussions about daily return action.
Here we present daily total return data from the Ken French library:
- Value-weight return of all CRSP firms incorporated in the US and listed on the NYSE, AMEX, or NASDAQ that have a CRSP share code of 10 or 11 (essentially ordinary common shares).
There are 23,509 daily return in total.
Daily Return Distribution:
The results are hypothetical results and are NOT an indicator of future results and do NOT represent returns that any investor actually attained. Indexes are unmanaged, do not reflect management or trading fees, and one cannot invest directly in an index. Additional information regarding the construction of these results is available upon request.
Here are the specific stats:
| Bucket | Observations | Frequency | Cumulative |
| Less than -5.00% | 59 | 0.25% | 0.25% |
| -4.50% | 20 | 0.09% | 0.34% |
| -4.00% | 31 | 0.13% | 0.47% |
| -3.50% | 46 | 0.20% | 0.66% |
| -3.00% | 85 | 0.36% | 1.03% |
| -2.50% | 164 | 0.70% | 1.72% |
| -2.00% | 289 | 1.23% | 2.95% |
| -1.50% | 547 | 2.33% | 5.28% |
| -1.00% | 1154 | 4.91% | 10.19% |
| -0.50% | 2566 | 10.91% | 21.10% |
| 0.00% | 5599 | 23.82% | 44.92% |
| 0.50% | 7048 | 29.98% | 74.90% |
| 1.00% | 3416 | 14.53% | 89.43% |
| 1.50% | 1331 | 5.66% | 95.09% |
| 2.00% | 563 | 2.39% | 97.49% |
| 2.50% | 237 | 1.01% | 98.49% |
| 3.00% | 115 | 0.49% | 98.98% |
| 3.50% | 69 | 0.29% | 99.28% |
| 4.00% | 61 | 0.26% | 99.54% |
| 4.50% | 37 | 0.16% | 99.69% |
| 5.00% | 19 | 0.08% | 99.77% |
| More than 5.00% | 53 | 0.23% | 100.00% |
The results are hypothetical results and are NOT an indicator of future results and do NOT represent returns that any investor actually attained. Indexes are unmanaged, do not reflect management or trading fees, and one cannot invest directly in an index. Additional information regarding the construction of these results is available upon request.
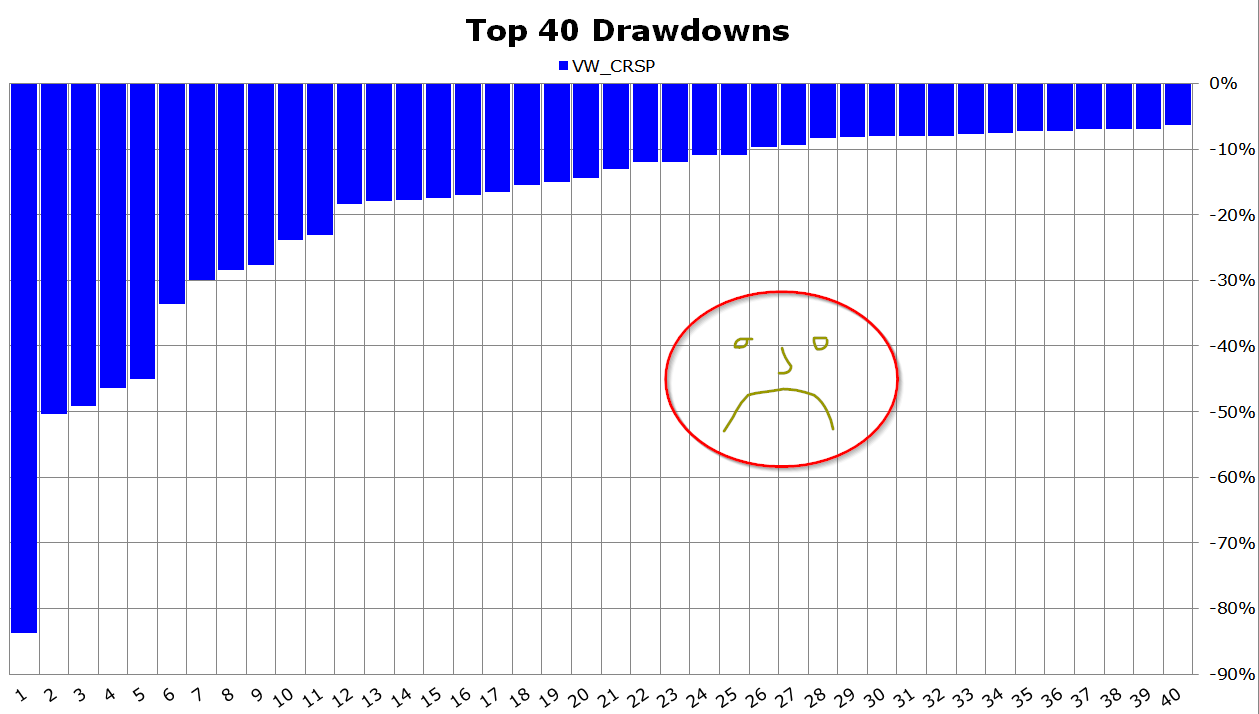
How about drawdowns?
Daily returns are one thing–let’s review the top 40 stock market drawdowns over the past 90+ years.
- VW CRSP = Value-weight CRSP universe of AMEX, NYSE, and Nasdaq stocks (Basically S&P 500).
- LTR = 10-Year Total Return
Monthly returns, gross of fees, total returns (e.g., including dividends).
| Rank | Date Start | Date End | VW_CRSP | LTR |
| 1 | 8/30/1929 | 6/30/1932 | -83.67% | 14.29% |
| 2 | 10/31/2007 | 2/28/2009 | -50.37% | 20.55% |
| 3 | 2/27/1937 | 3/31/1938 | -49.18% | 0.22% |
| 4 | 12/31/1972 | 9/30/1974 | -46.46% | -6.05% |
| 5 | 8/31/2000 | 9/30/2002 | -45.09% | 33.46% |
| 6 | 11/30/1968 | 6/30/1970 | -33.56% | -8.02% |
| 7 | 8/31/1987 | 11/30/1987 | -29.91% | 2.55% |
| 8 | 8/31/1932 | 2/28/1933 | -28.47% | 0.88% |
| 9 | 4/30/1940 | 4/30/1942 | -27.62% | 6.99% |
| 10 | 5/31/1946 | 5/29/1947 | -23.85% | 1.04% |
| 11 | 12/31/1961 | 6/30/1962 | -23.06% | 3.97% |
| 12 | 1/31/1934 | 7/31/1934 | -18.34% | 6.59% |
| 13 | 8/31/1933 | 10/31/1933 | -17.95% | -0.68% |
| 14 | 4/30/2011 | 9/30/2011 | -17.71% | 9.44% |
| 15 | 6/30/1998 | 8/31/1998 | -17.39% | 3.70% |
| 16 | 5/31/1990 | 10/31/1990 | -16.97% | 3.59% |
| 17 | 11/30/1980 | 7/31/1982 | -16.62% | 17.87% |
| 18 | 1/31/1966 | 9/30/1966 | -15.45% | -0.18% |
| 19 | 7/31/1957 | 12/31/1957 | -14.95% | 8.86% |
| 20 | 12/31/1938 | 4/29/1939 | -14.33% | 3.87% |
| 21 | 4/30/2010 | 6/30/2010 | -12.99% | 4.68% |
| 22 | 1/31/1980 | 3/31/1980 | -11.98% | -7.67% |
| 23 | 8/31/1978 | 10/31/1978 | -11.95% | -3.04% |
| 24 | 5/28/1948 | 11/30/1948 | -10.88% | -0.08% |
| 25 | 6/30/1983 | 5/31/1984 | -10.83% | -2.59% |
| 26 | 3/31/2000 | 5/31/2000 | -9.64% | -0.10% |
| 27 | 12/31/1976 | 2/28/1978 | -9.33% | -1.45% |
| 28 | 7/31/1956 | 2/28/1957 | -8.37% | -0.65% |
| 29 | 8/31/1986 | 9/30/1986 | -8.15% | -2.07% |
| 30 | 3/31/1936 | 4/30/1936 | -8.02% | 0.35% |
| 31 | 12/31/1959 | 10/31/1960 | -7.97% | 11.44% |
| 32 | 12/31/1947 | 2/28/1948 | -7.94% | 0.66% |
| 33 | 6/30/1943 | 11/30/1943 | -7.76% | 0.36% |
| 34 | 1/31/1994 | 6/30/1994 | -7.60% | -6.78% |
| 35 | 12/31/1989 | 1/31/1990 | -7.28% | -1.99% |
| 36 | 9/30/1979 | 10/31/1979 | -7.23% | -8.41% |
| 37 | 3/31/2012 | 5/31/2012 | -6.98% | 4.23% |
| 38 | 12/31/1952 | 8/31/1953 | -6.95% | -1.66% |
| 39 | 12/31/1967 | 2/29/1968 | -6.89% | 2.94% |
| 40 | 6/30/1999 | 9/30/1999 | -6.37% | 0.94% |
The results are hypothetical results and are NOT an indicator of future results and do NOT represent returns that any investor actually attained. Indexes are unmanaged, do not reflect management or trading fees, and one cannot invest directly in an index. Additional information regarding the construction of these results is available upon request.
And here are the numbers outlined on a chart:
The results are hypothetical results and are NOT an indicator of future results and do NOT represent returns that any investor actually attained. Indexes are unmanaged, do not reflect management or trading fees, and one cannot invest directly in an index. Additional information regarding the construction of these results is available upon request.
Clearly, if you can’t handle volatility, you shouldn’t be in the stock market.

About the Author: Wesley Gray, PhD
—
Important Disclosures
For informational and educational purposes only and should not be construed as specific investment, accounting, legal, or tax advice. Certain information is deemed to be reliable, but its accuracy and completeness cannot be guaranteed. Third party information may become outdated or otherwise superseded without notice. Neither the Securities and Exchange Commission (SEC) nor any other federal or state agency has approved, determined the accuracy, or confirmed the adequacy of this article.
The views and opinions expressed herein are those of the author and do not necessarily reflect the views of Alpha Architect, its affiliates or its employees. Our full disclosures are available here. Definitions of common statistics used in our analysis are available here (towards the bottom).
Join thousands of other readers and subscribe to our blog.