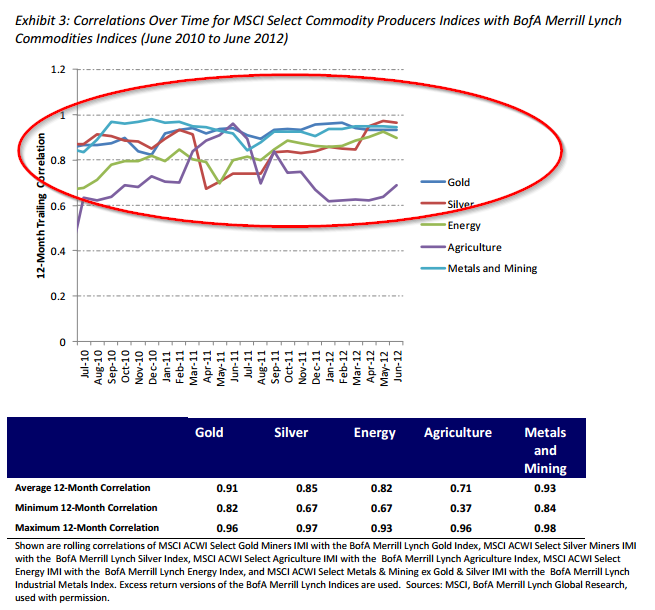
This past year we examined the possibility of replicating commodity exposure via equities. The project was spurred by an insightful research report from MSCI, which showed some impressive results. Other research outfits have proposed similar concepts. The figure below, taken from the MSCI report, highlights how well the MSCI Select Commodity Producers Index replicates various commodity indices over the 2010-2012:
The results are hypothetical results and are NOT an indicator of future results and do NOT represent returns that any investor actually attained. Indexes are unmanaged, do not reflect management or trading fees, and one cannot invest directly in an index. Additional information regarding the construction of these results is available upon request.
We replicate these results and come to similar conclusions: Correlations for commodities and commodity-related-equities are >.8 from 2010-2012.
However…and this is a big however…
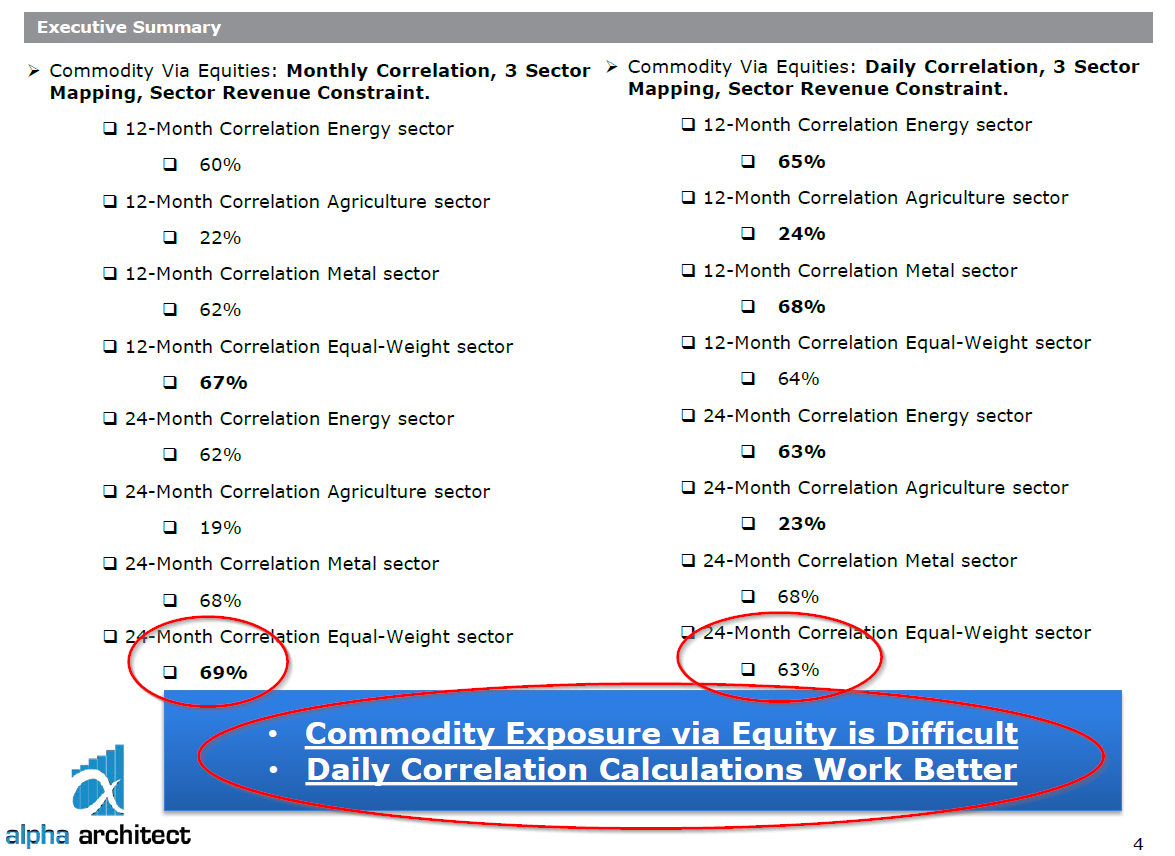
When we look at a longer out-of-sample period, from 1991 to 2014, correlations are much lower (the best versions of our algorithms can get the correlation in the .6-.7 range after intense data-mining). The executive summary below is from a 125-page internal report we did on commodity via equity replication. The correlation figures represent the full-sample correlations between the underlying commodities and some of our top replication techniques. Clearly, the evidence below suggests that we should be skeptical of claims that commodity exposures can be effectively replicated via commodity-related-equities. Especially, when the sample period analyzed is short.
The results are hypothetical results and are NOT an indicator of future results and do NOT represent returns that any investor actually attained. Indexes are unmanaged, do not reflect management or trading fees, and one cannot invest directly in an index. Additional information regarding the construction of these results is available upon request.
Understanding Commodity Replication via Equities
Accessing commodity exposures can be complicated.
Consider oil exposure: Buy oil futures? The oil ETF? Oil stocks? Each of these option has pros and cons.
Futures
Futures appear straight forward, and require less margin than equities; however, these contracts trade in large notional amounts (eliminating the option for retail investors), incur transaction costs (potential roll costs and other transaction costs), and trading futures should not be viewed as a buy-and-hold investment (e.g., see research here and here). Many investors view commodity futures like stocks, where an investor simply buys and holds over the long term and grinds out the equity risk premium. But this is not the right frame of thinking. Commodity futures aren’t equities. Futures are a traded asset class and being active–not passive–is the only way to capture the potential risk premiums offered by commodities (e.g., term structure).
ETFs that own futures
One can buy an oil ETF that owns oil futures, which is simple and requires less capital, but there are management fees and these funds still have embedded future trading costs.
Stock replication
One could also explore investing in stocks that are in the oil business. This approach has some huge potential benefits: tax-efficiency (i.e., deferral), simplicity, no roll risks, dividend payments, etc. However, the biggest risk is that oil stocks may not necessarily capture the exposure of oil future prices. For example, some oil producers may hedge production, thus limiting their business exposure to underlying oil price fluctuations, and thus their correlation to the underlying commodity. In order to deal with this risk, one needs to engineer a specific portfolio and actively manage the exposures.
How to Replicate Commodity Futures via Equity Portfolios
In this piece we look at different algorithms that form portfolios meant to capture commodity risk exposure via equities.
To facilitate understanding, we focus on an analysis of the energy sector.
In order to replicate commodity returns with stocks, we look at 3 approaches (one can mix and match or add additional techniques, but these are the big muscle movements):
- Identify commodity-related sectors and the associated stocks (e.g., oil sectors stocks should follow oil more than information technology stocks would)
- Identify % revenue generated by specific sectors (e.g., an oil stock that generates 95% of its revenue from the oil sector is better than one with 51%)
- Identify past correlations between stocks and commodities (e.g., an oil stock with a 90% historical correlation is better than one with a 50% correlation)
In the end, we perform a variety of data-mining techniques that mix and match various elements to try and data-fit the portfolio’s that have the highest correlation out-of-sample.
Here is an example combination approach that seems to be most effective in our research:
- Identify companies in a specific SIC sector (e.g., primary SIC code is energy).
- Confirm firms identified have 50%+ of their revenue from energy
- For firms identified in steps 1&2, calculate rolling past 12-month correlations with energy returns.
- Purchase the top 10% highest correlated firms (can equal-weight or value-weight the portfolio)
- Monthly re-balance.
Some Example Results
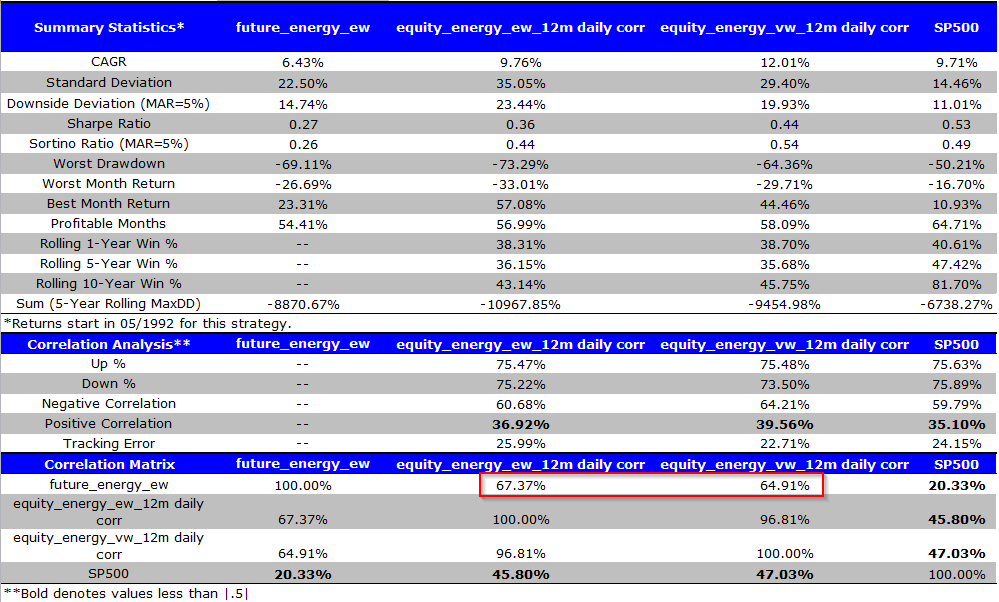
- SP500 = S&P 500 Total Return Index
- future_energy_ew= equal weighted across 6 energy futures (natural gas, crude oil, brent crude, gasoline, heating oil, and gas oil)
- equity_energy_ew_12m daily corr = equal weighted, top 10% 12-month rolling correlation using daily returns, re-balance at the end of month
- equity_energy_vw_12m daily corr = value weighted, top 10% 12-month rolling correlation using daily returns, re-balance at the end of month
Results are gross of fees. All returns are total returns and include the reinvestment of distributions (e.g., dividends). Indexes are unmanaged, do not reflect management or trading fees, and one cannot invest directly in an index.
Summary Performance 1992/05 to 2014/12
The results are hypothetical results and are NOT an indicator of future results and do NOT represent returns that any investor actually attained. Indexes are unmanaged, do not reflect management or trading fees, and one cannot invest directly in an index. Additional information regarding the construction of these results is available upon request.
The correlation results are not promising–average correlation is 65-67%–a far cry from the 90%+ results we’d like to see if we wanted to replicate commodity future returns with equity.
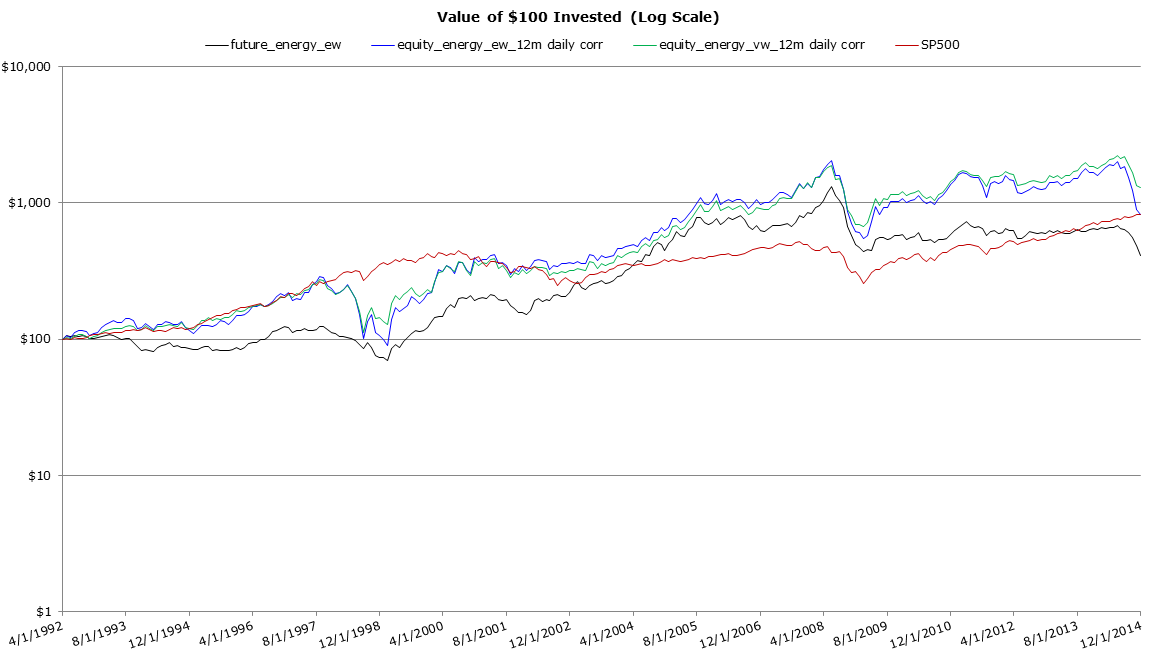
Invested Growth 1992/05 to 2014/12
The results are hypothetical results and are NOT an indicator of future results and do NOT represent returns that any investor actually attained. Indexes are unmanaged, do not reflect management or trading fees, and one cannot invest directly in an index. Additional information regarding the construction of these results is available upon request.
Energy related stocks don’t track energy sector futures that well over time.
Looking inside the black box: Sample stock names as of 2014/12/31, market cap in millions
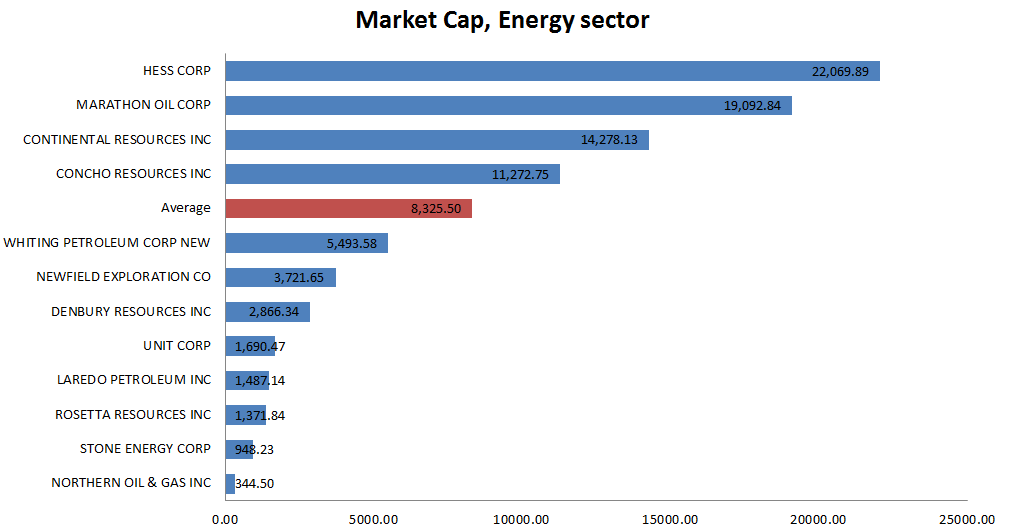
The results are hypothetical results and are NOT an indicator of future results and do NOT represent returns that any investor actually attained. Indexes are unmanaged, do not reflect management or trading fees, and one cannot invest directly in an index. Additional information regarding the construction of these results is available upon request.
Conclusion
Based on the analysis above, replicating commodity futures via equity is mediocre at best. In contrast to MSCI, we’re not convinced.
Determining if commodity exposure is a benefit to a portfolio is a complex issue, but given one believes in the benefit of exposing a portfolio to the commodity sector, trying to access these exposures via equity replication probably isn’t going to work that well…at least not as well as previously contemplated.

About the Author: Wesley Gray, PhD
—
Important Disclosures
For informational and educational purposes only and should not be construed as specific investment, accounting, legal, or tax advice. Certain information is deemed to be reliable, but its accuracy and completeness cannot be guaranteed. Third party information may become outdated or otherwise superseded without notice. Neither the Securities and Exchange Commission (SEC) nor any other federal or state agency has approved, determined the accuracy, or confirmed the adequacy of this article.
The views and opinions expressed herein are those of the author and do not necessarily reflect the views of Alpha Architect, its affiliates or its employees. Our full disclosures are available here. Definitions of common statistics used in our analysis are available here (towards the bottom).
Join thousands of other readers and subscribe to our blog.