Here we highlight an interesting working paper titled “Absolute Strength: Exploring Momentum in Stock Returns” by Gulen and Petkova (2015).
The abstract is the following:
We document a new pattern in stock returns that we call absolute strength momentum. Stocks that have significantly increased in value in the recent past (absolute strength winners) continue to gain, and stocks that have significantly decreased in value (absolute strength losers) continue to lose in the near future. Absolute strength winner and loser portfolio breakpoints are recursively determined by the historical distribution of realized cumulative returns across time and across stocks. The historical distribution yields stable breakpoints that are always positive (negative) for the winner (loser) portfolios. As a result, winners are those that have experienced a significant upward trend, losers are those that have experienced a significant downward trend, and stocks with no momentum have cumulative returns that are not significantly different from zero. The absolute strength momentum strategy is related to, but different from, the relative strength momentum strategy of Jagadeesh and Titman (1993) and the time series momentum strategy of Moskowitz, Ooi, and Pedersen (2011). Time-series regressions show that the returns to the absolute strength momentum strategy completely explain the returns to the relative strength and the time series momentum strategies, but not vice versa. Absolute strength momentum does not expose investors to severe crashes during crisis periods, and its profits are remarkably consistent over time. For example, an 11-1-1 strategy that buys absolute strength winners and sells absolute strength losers delivers a risk-adjusted return of 2.42% per month from 1965-2014 and 1.55% per month from 2000-2014.
Our Summary of the Paper:
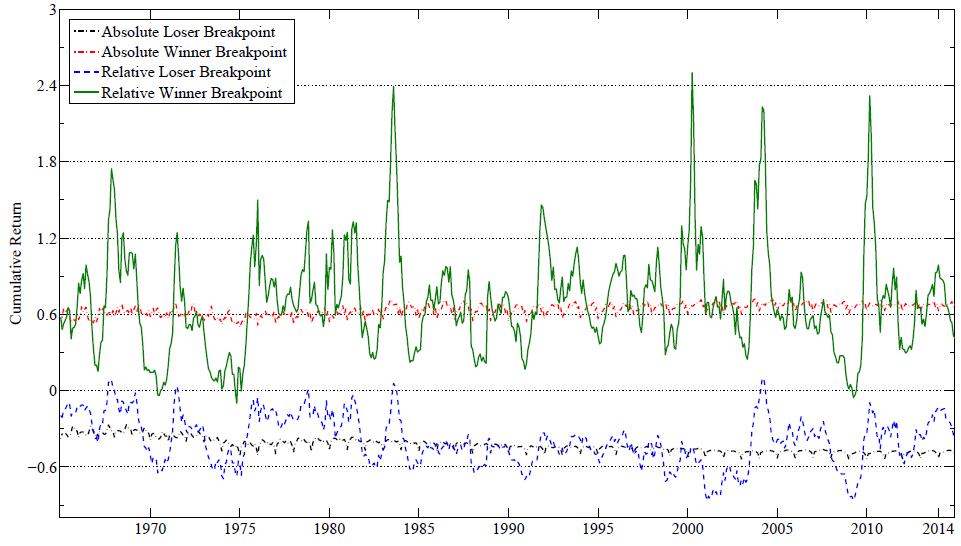
Momentum investing in the academic literature, is fairly standard — rank firms on their past 12 month momentum (or past 12_2 momentum — ignoring last month’s return), and buy the highest momentum firms and sell the lowest momentum firms. Most papers usually use the top and bottom decile, ie. the 10th and 90th percentiles. However, the classification of a “winner” stock and a “loser” stock changes over time. During the internet bubble, to be classified as a “winner” a firm needed to have a past momentum score of around 250% (near the peak). During the 2008/2009 credit crisis, a “winner” stock would be any stock with a return above -5%! (these cutoffs are according to the paper). Clearly this is a wide range across time to classify “winning” stocks. The same occurs for losing stocks — the range varies across time.
An alternative screening methodology would be to use an “absolute” strength score. The idea is to look back each month at the historical cutoffs for winners and losers, while using all available returns to create the cutoffs. An example describes the method. On 1/31/1965 examine all the momentum scores (past 12_2 momentum) for all stocks measured in January every year. This would be all the momentum scores on 1/31/1927, 1/31/1928, … 1/31/1965. From this sample, pick the 10th and 90th percentiles to be the “absolute” momentum cutoffs. This is done each month, while adding in new observations (so the sample size for each month grows each year).
Below shows the cutoffs (both relative and absolute) across time from the paper:
The results are hypothetical results and are NOT an indicator of future results and do NOT represent returns that any investor actually attained. Indexes are unmanaged, do not reflect management or trading fees, and one cannot invest directly in an index. Additional information regarding the construction of these results is available upon request.
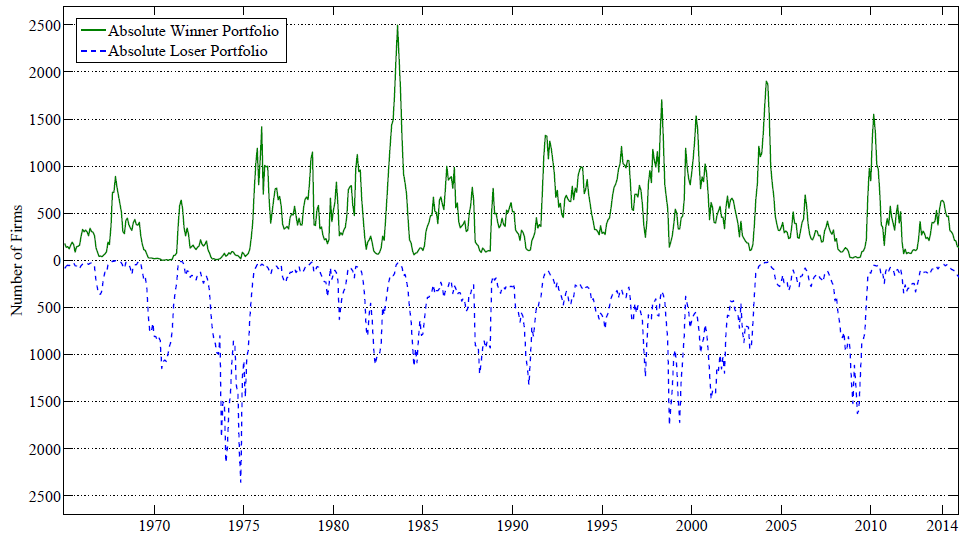
It becomes clear that the “absolute” momentum cutoffs are more consistent across time. The “winning” stock cutoff is near 60%, while the “losing” stock cutoff is around -35% to -40%. The idea is that each month, we would only include a stock in the winner (loser) portfolio if their past momentum is above (below) the more stable absolute momentum cutoff. However, this will lead to instances where there are not many stocks in the portfolio. Below is a figure from the paper showing the number of firms in the high and low absolute momentum portfolios across time.
The results are hypothetical results and are NOT an indicator of future results and do NOT represent returns that any investor actually attained. Indexes are unmanaged, do not reflect management or trading fees, and one cannot invest directly in an index. Additional information regarding the construction of these results is available upon request.
Clearly, the number of firms in the top and bottom decile based on absolute momentum rules varies wildly across time. In the recent 2008/2009 credit crisis, the number of winners drops to close to 0, while the number of losers goes above 1,500! A relative strength momentum rule on the other hand, will always buy the top 10% and sell the bottom 10%. So if there are 5,000 firms in the universe, the relative strength portfolio will always buy 500 stocks and sell 500 stocks.
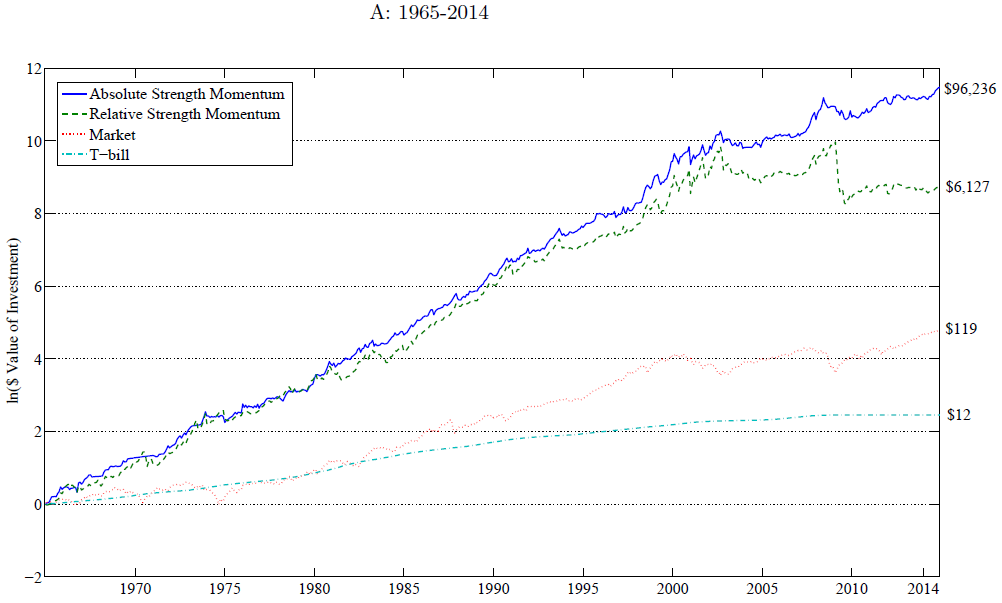
Portfolio construction aside (we will come back to this later), how does the absolute strength momentum strategy perform compared to the more common relative strength momentum strategy?
Here are the results from 1965-2014 from the paper:
The results are hypothetical results and are NOT an indicator of future results and do NOT represent returns that any investor actually attained. Indexes are unmanaged, do not reflect management or trading fees, and one cannot invest directly in an index. Additional information regarding the construction of these results is available upon request.
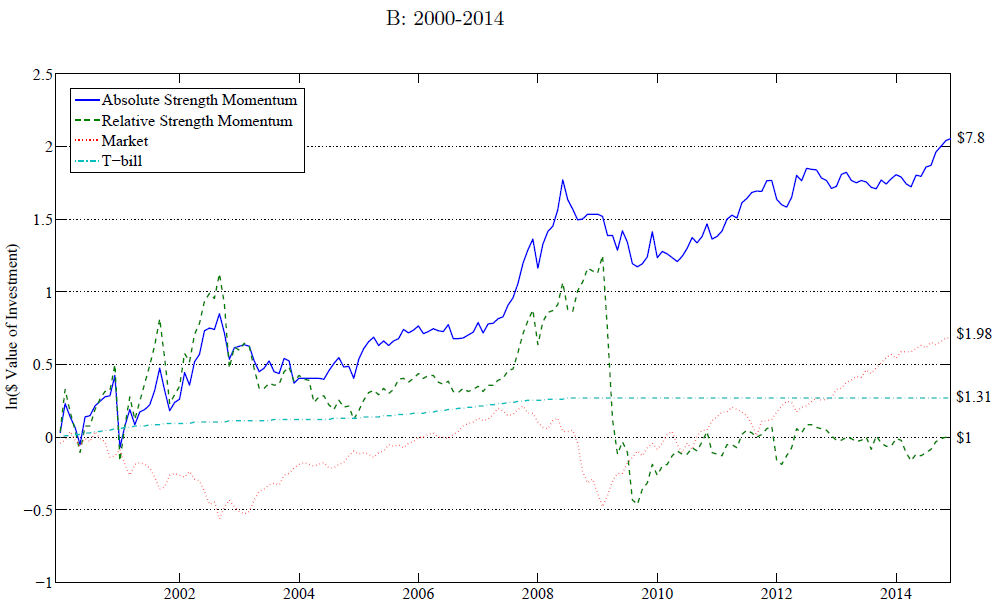
And here are the results from 2000-2014 from the paper:
The results are hypothetical results and are NOT an indicator of future results and do NOT represent returns that any investor actually attained. Indexes are unmanaged, do not reflect management or trading fees, and one cannot invest directly in an index. Additional information regarding the construction of these results is available upon request.
Wow! Baseline results to the long/short portfolios are impressive! Both the Absolute Strength Momentum portfolio and the Relative Strength Momentum portfolio go long the winner stocks and short the loser stocks, using the cutoffs describes above.
However, we always like to examine new research and determine the feasibility of possibly trading on the idea.
An very important caveat to the figure and results above — this includes ALL domestic U.S. stocks above $1.00 (including microcaps stocks, which make up around 60% of the names in the CRSP universe, but only ~3% of the marketcap according to Fama and French 2008). Imagine trying to short hundreds of microcap stocks! Since there may be a size effect, we decided to bring the analysis in-house.
Our Analysis:
We decided to perform a similar analysis from 1965-2014, while only examining firms above the NYSE 40th percentile for marketcap. This allows us to focus the results on mid/large cap firms. We similarly create our own absolute momentum signal using only mid/large cap firms (we get similar breakpoints in the paper).
Here are the long/short returns to the equal-weighted monthly rebalanced portfolios from 1/1965-12/2014. All returns shown are total returns but are gross of any fees and transaction costs.
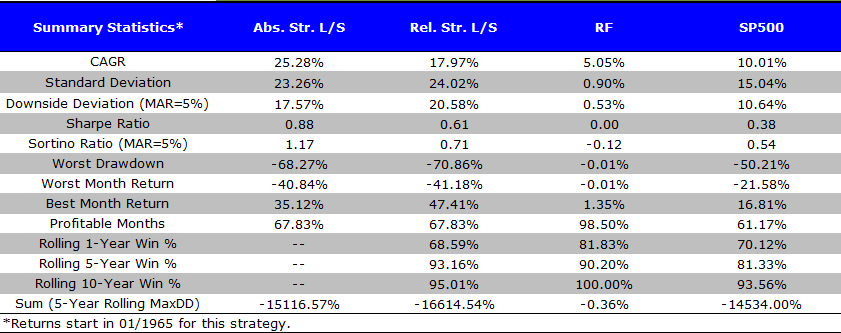
The results are hypothetical results and are NOT an indicator of future results and do NOT represent returns that any investor actually attained. Indexes are unmanaged, do not reflect management or trading fees, and one cannot invest directly in an index. Additional information regarding the construction of these results is available upon request.
Overall, the results are similar to the paper — the absolute strength long/short portfolio outperforms the relative strength portfolio when comparing CAGR, Sharpe and Sortino ratios. However, these are the long/short returns. Let’s examine the individual legs of the portfolios.
Below we show the results to the four portfolios (Absolute Strength Winners and Losers; Relative Strength Winners and Losers). Portfolios are equal-weighted and rebalanced monthly from 1/1965-12/2014. All returns shown are total returns but are gross of any fees and transaction costs.
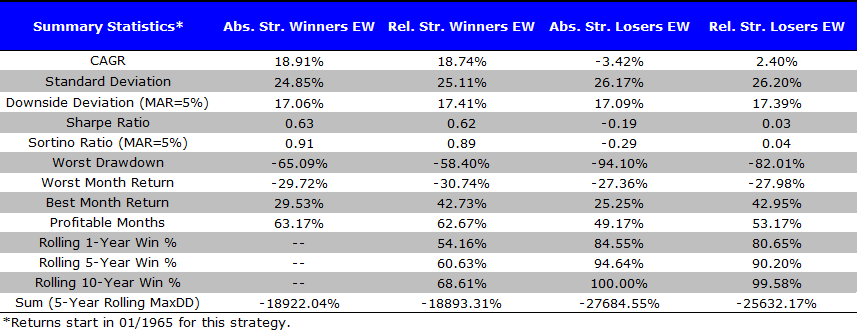
The results are hypothetical results and are NOT an indicator of future results and do NOT represent returns that any investor actually attained. Indexes are unmanaged, do not reflect management or trading fees, and one cannot invest directly in an index. Additional information regarding the construction of these results is available upon request.
Examining the results, we see that the “winner” portfolios are very similar from a CAGR and risk-adjusted (Sharpe and Sortino ratios) analysis. However, the Absolute Strength Loser portfolio outperforms the Relative Strength Loser portfolio by around 5.8% annually! So it appears that the outperformance (on mid/large cap firms) of the Absolute Strength strategy is driven by the loser portfolio (short book).
Another potential issue (which we highlighted above) is that the absolute strength rule can create portfolios with varying N’s from month to month. Alternatively, the relative strength signal creates a highly consistent N in the portfolio from month to month. Below we show the N’s for the portfolio every month (as well as the Universe of stocks we are working with).
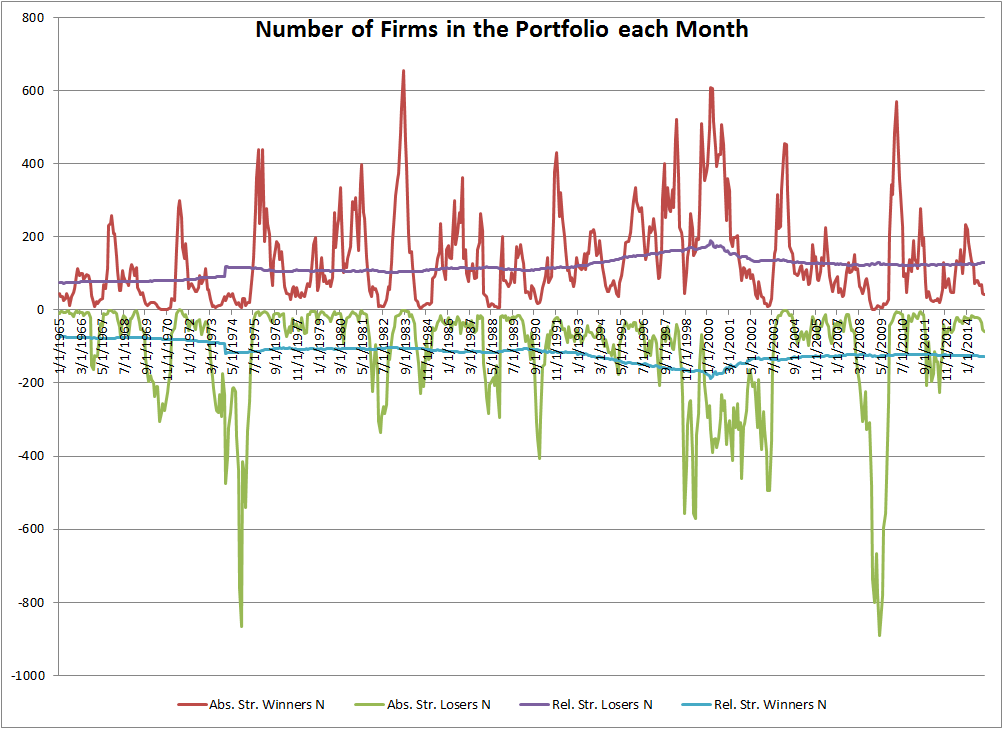
The results are hypothetical results and are NOT an indicator of future results and do NOT represent returns that any investor actually attained. Indexes are unmanaged, do not reflect management or trading fees, and one cannot invest directly in an index. Additional information regarding the construction of these results is available upon request.
One can see the benefits of running the relative strength portfolio from a risk-management standpoint. Every month, there is a consistent number of firms in the portfolio when using relative strength (the average from 1965-2014 is 116 stocks each month). Using the absolute strength rule, the number of firms in the portfolio varies. In 5.5% (12.17%) of the months, the number of firms in the winner (loser) portfolio is less than 10 stocks! In two months (one for the winner, one for the loser), there are no firms in the portfolio!
Summary:
Overall, the paper has a nice story. However, the varying N’s in the portfolio can cause an investor to take on the risk of very few firms across time. Another issue is that the added outperformance of the absolute strength rule (over the relative strength rule) is driven by the short book (for mid/large cap firms), which can have high costs to manage. An adept short-trader who can take on high amount of firm-specific risk may find this strategy worthwhile.
We prefer to focus on long-only strategies. As shown above, the absolute strength rule does not add much value over the relative strength rule — so we still prefer to use the relative strength rule as the N’s in the portfolio are consistent over time. As we show here, momentum investing has historically been a good strategy, and can be combined with value investing as shown here and here.
I hope you enjoyed the summary!!!

About the Author: Jack Vogel, PhD
—
Important Disclosures
For informational and educational purposes only and should not be construed as specific investment, accounting, legal, or tax advice. Certain information is deemed to be reliable, but its accuracy and completeness cannot be guaranteed. Third party information may become outdated or otherwise superseded without notice. Neither the Securities and Exchange Commission (SEC) nor any other federal or state agency has approved, determined the accuracy, or confirmed the adequacy of this article.
The views and opinions expressed herein are those of the author and do not necessarily reflect the views of Alpha Architect, its affiliates or its employees. Our full disclosures are available here. Definitions of common statistics used in our analysis are available here (towards the bottom).
Join thousands of other readers and subscribe to our blog.