Kewei Hou and Roger Loh have a fun paper on the idiosyncratic volatility puzzle, which is set to be published in the Journal of Financial Economics. The idiosyncratic volatility puzzle is associated with the empirical evidence which suggests that stocks with higher idiosyncratic volatility (volatility left over after controlling for “systematic” risk factors) earn lower returns. Rough cut finance theory would suggest 1) that the relationship should be flat because investors can hold well diversified portfolios and thus, idiosyncratic, or random, volatility washes away, or 2) the relationship should be positive because investors need to price idiosyncratic volatility because it is costly to be completely diversified. Readers can learn more on volatility anomalies here.
Hou and Loh try and solve the puzzle and determine that the anomaly is likely driven by an assortment of behavioral biases and market frictions that create limits of arbitrage. However, they conclude that the puzzle is still puzzling.
Have We Solved the Idiosyncratic Volatility Puzzle?
We propose a simple methodology to evaluate a large number of potential explanations for the negative relation between idiosyncratic volatility and subsequent stock returns (the idiosyncratic volatility puzzle). We find that surprisingly many existing explanations explain less than 10% of the puzzle. On the other hand, explanations based on investors’ lottery preferences and market frictions show some promise in explaining the puzzle. Together, all existing explanations account for 29-54% of the puzzle in individual stocks and 78-84% of the puzzle in idiosyncratic volatility-sorted portfolios. Our methodology can be applied to evaluate competing explanations for other asset pricing anomalies.
First, the evidence on the puzzle, which shows the negative relationship between ivol and returns, even after controlling for everything under the sun:
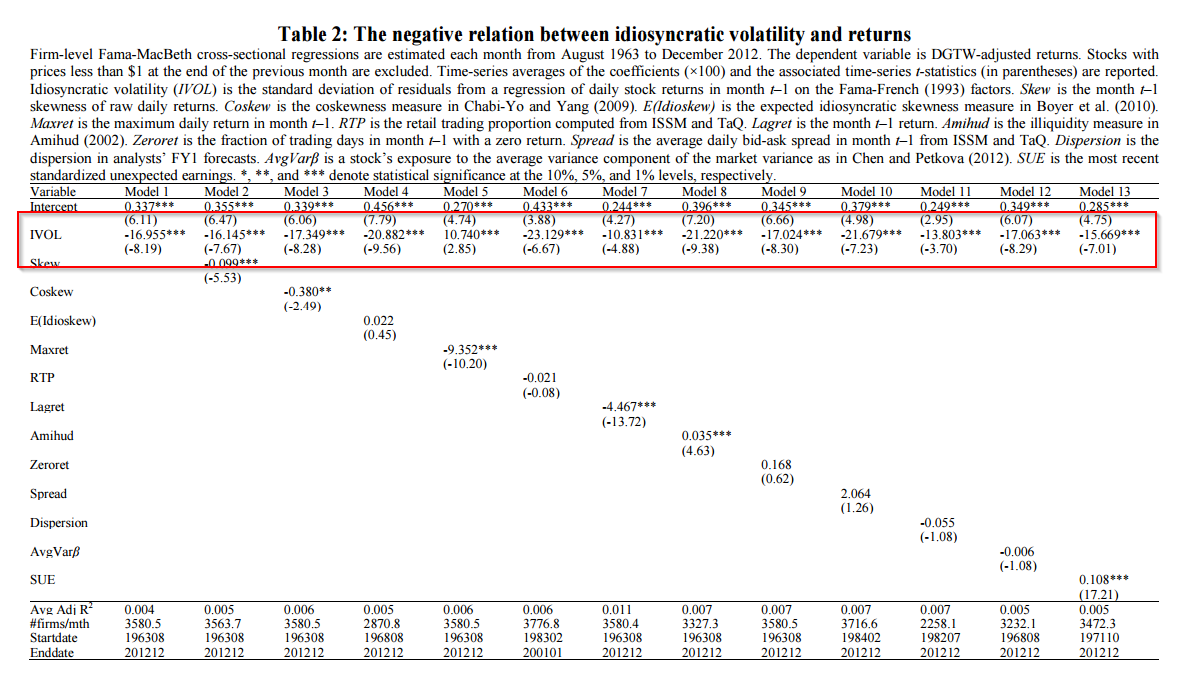
The results are hypothetical results and are NOT an indicator of future results and do NOT represent returns that any investor actually attained. Indexes are unmanaged, do not reflect management or trading fees, and one cannot invest directly in an index.
And next comes their decomposition to try and understand what is going on. There is a lot to be explained, but behavioral reasons and market frictions are the most plausible explanations.
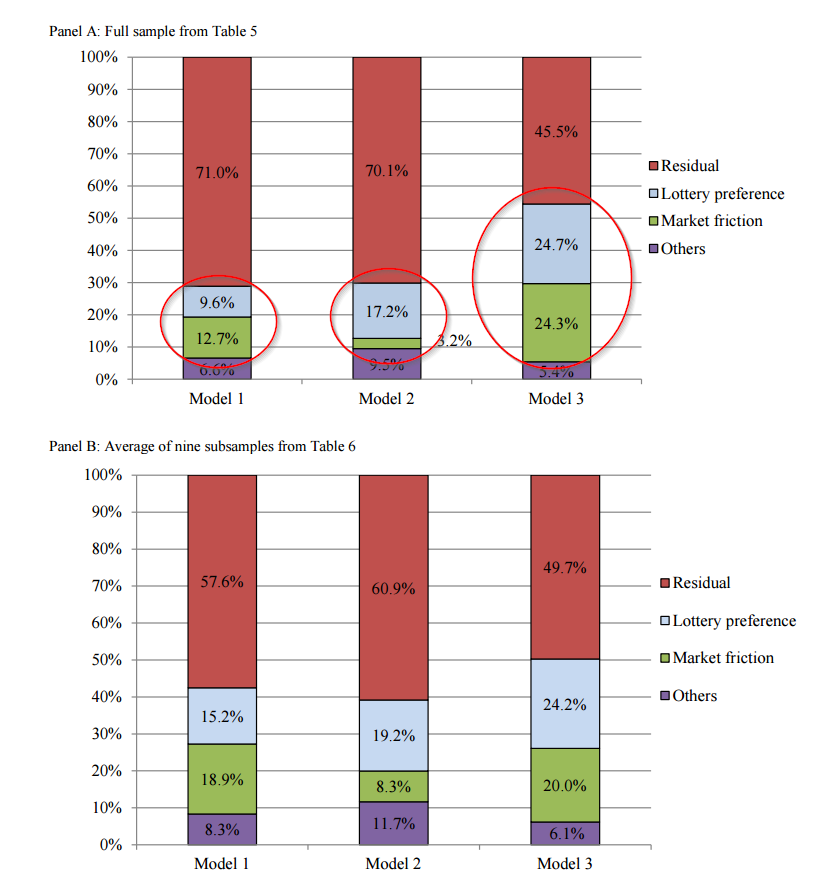
The results are hypothetical results and are NOT an indicator of future results and do NOT represent returns that any investor actually attained. Indexes are unmanaged, do not reflect management or trading fees, and one cannot invest directly in an index.

About the Author: Wesley Gray, PhD
—
Important Disclosures
For informational and educational purposes only and should not be construed as specific investment, accounting, legal, or tax advice. Certain information is deemed to be reliable, but its accuracy and completeness cannot be guaranteed. Third party information may become outdated or otherwise superseded without notice. Neither the Securities and Exchange Commission (SEC) nor any other federal or state agency has approved, determined the accuracy, or confirmed the adequacy of this article.
The views and opinions expressed herein are those of the author and do not necessarily reflect the views of Alpha Architect, its affiliates or its employees. Our full disclosures are available here. Definitions of common statistics used in our analysis are available here (towards the bottom).
Join thousands of other readers and subscribe to our blog.