Causes and Seasonality of Momentum Profits
- Richard Sias
- A version of the paper can be found here.
- Want a summary of academic papers with alpha? Check out our Academic Research Recap Category.
Abstract:
With Januaries (a month in which lagged “losers” typically outperform lagged “winners”) excluded, the average monthly return to a momentum strategy for U.S. stocks was found to be 59 bps for non-quarter-ending months but 310 bps for quarter-ending months. The pattern was stronger for stocks with high levels of institutional trading and was particularly strong in December. The results suggest that window dressing by institutional investors and tax-loss selling contribute to stock return momentum. Investors using a momentum strategy should focus on quarter-ending months and securities with high levels of institutional trading.
Alpha Highlight:
The free market for academic research ideas is extremely competitive. If you have an idea–and there is a dataset associated with the idea–one can be (almost) certain that there is a paper written on the subject and/or the idea was already tested and the t-stats weren’t high enough for publication (sad, but true).
The paper below is–unfortunately–an example of research competition…
Around 4 years ago, Jack and I started working on our “unique” idea of examining how tax-loss selling and window-dressing would affect a momentum strategy. We generated all of our results and we thought we were on our way to another academic publication. What excited us even more was the fact that this idea had never been published in a top-tier academic journal (e.g., The Journal of Finance, Journal of Financial Economics, Review of Financial Studies). Of course, as a last check we reviewed the “practitioner” journals to make sure it hadn’t been covered (e.g., FAJ, Journal of Portfolio Management). Turns out Richard Sias had already published the paper in a well-known practitioner journal, the FAJ, back in 2007! Jack and I were disappointed, but also happy, because our robust momentum seasonality findings had been confirmed by an independent party. We were also surprised that despite how much momentum seasonality matters to momentum strategies, research in top-tier academic journals on momentum had rarely even considered seasonality. Clearly, the professors aren’t reading the practitioner journals!
Enough about back story, what drives momentum seasonality?
Window Dressing
Sias hypothesizes that the results above are due to “window dressing.” Window dressing, for those who are unfamiliar with the term, is an odd behavior exhibited by professional money managers who cater to less sophisticated clients.
In the retail business, “window dressing” refers to the practice of arranging merchandise in a store window to make it appear as attractive as possible. This brings customers in the store, even if the merchandise is not as good as it looks in the window. In the financial services industry, managers can similarly arrange their merchandise.
Here is how it works: The manager knows that they must report their holdings on quarterly and/or annual statements and these statements will get mailed to their clients. But the last thing they want their clients to see on those statements is their trash stocks that underperformed the market. You don’t want these stocks in the “window” people will be viewing. To manage around this scenario the manager will sell their “black eye” stocks and buy all the recent winners. Voila! The window now looks much more enticing.
Obviously, window dressing is not going to be a cure for bad performance, but the hope is that this activity will at least make them appear to have been doing something reasonable, and reduce client questions when they receive their statements.
Consider the two scenarios:
- “Geez, you underperformed by 10%. And wow, you owned Blackberry? …Why do you own that horrible stock?! You really must be an idiot.”
- “Geez, you underperformed by 10%. And wow, you owned Apple? …That is a good stock that has done well. You seem like a good manager so I guess you had an unlucky stretch.”
Clearly, the manager would much rather field the second question, and not the first question. And because annual reports are much more “available” than quarterly reports, the window-dressing effect is hypothesized to be more powerful surrounding the annual report.
Tax-motivated Trading
One our favorite topics is the value of tax minimization, so we are predisposed to believe in the tax-motivated momentum seasonality story. The story works as follows: At year end, taxable investors would rather jump off a bridge than realize a large capital gain in November or December. Similarly, taxable investors eagerly realize losses on big losers so they can use the tax-losses to offset gains in other areas of their portfolio. Mechanically, holding on to high momentum stocks and aggressively selling low momentum stocks, leads to an enhanced momentum effect towards the year end.
Great theories, what are the results?
The window-dressing hypothesis outlined above suggests that the momentum effect will be concentrated in quarter-end periods. One would also expect the window-dressing effect to more extreme for those stocks with higher institutional trading versus lower institutional trading. Why? Because it is the institutions-the funds-who have the window dressing incentive. If a stock is owned mostly by retail investors, those investors have no window to dress.
The tax-motivated hypothesis runs parallel to the window-dressing hypothesis and suggests that the year-end momentum effects will be extreme because there is 1) window-dressing and 2) tax-incentives at play.
Sias finds strong evidence for both the window-dressing and tax-motivated hypotheses. Specifically, after excluding January, the average monthly return to a momentum strategy for U.S. stocks was found to be 59 bps for non-quarter-ending months but 310 bps for quarter-ending months. That’s a difference of over five times. The pattern was stronger for stocks with high levels of institutional trading and was particularly strong in December.
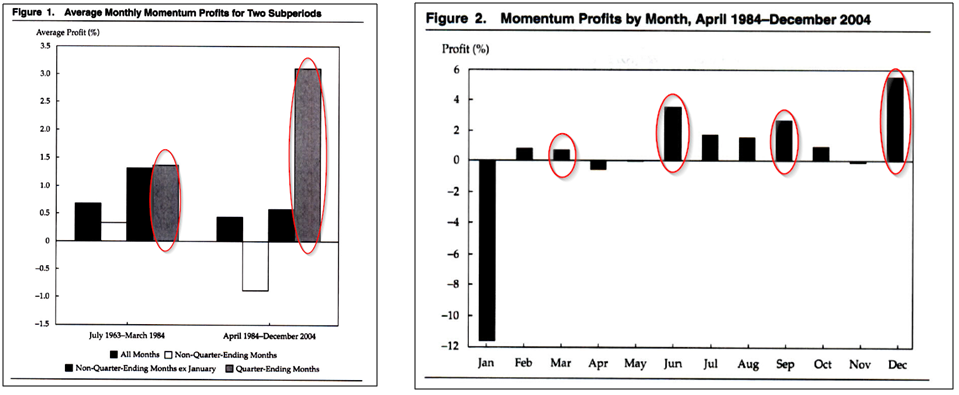
Let’s review two figures from the paper:
- Figure 1: From 7/1963 to 3/1984, momentum profits from non-quarter-ending months (ex January) were almost the same as momentum profits from quarter-ending months. However, from 4/1984 to 12/2004, we can see strong momentum seasonality for quarter-ending months.
- Figure 2: From 4/1984 to 12/2004, December exhibits the largest momentum profits (5.52%), followed by June (3.48%) and September (2.65%). Losses in January are huge…
The results are hypothetical results and are NOT an indicator of future results and do NOT represent returns that any investor actually attained. Indexes are unmanaged, do not reflect management or trading fees, and one cannot invest directly in an index. Additional information regarding the construction of these results is available upon request.
The evidence is pretty clear that seasonality plays a very role in momentum-based stock selection strategies. As an aside, we have extended these results to international markets and find strong evidence for the window-dressing hypothesis, but limited evidence for the tax-motivated hypothesis, which makes sense because tax regimes are different around the globe.
Conclusions
We won’t waste words here and will defer to Sias, who says it best:
Investors attempting to exploit return momentum should focus their efforts on quarter-ending months… — Sias (2007)

About the Author: Wesley Gray, PhD
—
Important Disclosures
For informational and educational purposes only and should not be construed as specific investment, accounting, legal, or tax advice. Certain information is deemed to be reliable, but its accuracy and completeness cannot be guaranteed. Third party information may become outdated or otherwise superseded without notice. Neither the Securities and Exchange Commission (SEC) nor any other federal or state agency has approved, determined the accuracy, or confirmed the adequacy of this article.
The views and opinions expressed herein are those of the author and do not necessarily reflect the views of Alpha Architect, its affiliates or its employees. Our full disclosures are available here. Definitions of common statistics used in our analysis are available here (towards the bottom).
Join thousands of other readers and subscribe to our blog.