Awww…modern portfolio theory…that feel-good construct I teach to all of my graduate-level finance students each year. Simply input 1) a vector of expected returns and 2) a covariance matrix into your computer, and voilà, you have your optimal portfolio weights.
Like all things viewed with the benefit of hindsight, it sounds so easy, but the underlying theory and assumptions earned Harry Markowitz a Nobel Prize for his original paper on Portfolio Selection. And even though we sometimes rant on why you should be skeptical of complex practical applications of modern portfolio theory, the concepts and ideas that underlie it are critical for building successful investment programs. And that includes knowing when to use and when not to use certain ideas.
Bottom line: One should only discount certain concepts if one understands them. Unfortunately, many investors discount concepts because they don’t understand them.
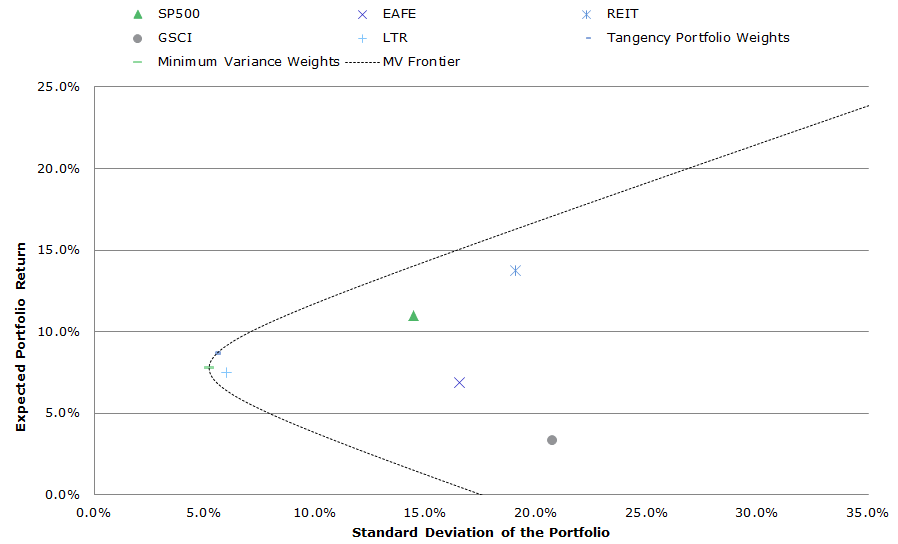
The big takeaway, or “punchline” if you will, from modern portfolio theory is the so-called mean-variance frontier (MV-frontier, also called the efficient frontier). The MV frontier simply maps out all the best expected combinations of risk/reward an investor can achieve by playing with the weights among the assets under investigation. Another important concept is the “tangency portfolio.” This portfolio is identified by the blue “-” in the chart below and sits on the CAL (capital allocation line). The tangency portfolio is the portfolio with the highest possible Sharpe ratio when used in combination with a risk-free asset (e.g., 90-day T-Bill). For those of you who haven’t taken an investment management course in a while, the CAL represents all combinations of the risk-free rate and the tangency portfolio. These are “optimal” portfolios because there is no possible way to achieve a higher risk/reward in expectation. The optimal allocation weights for a 100% risk investor (i.e., no allocation to risk-free bonds) is the tangency portfolio.
The chart below includes the “IVY 5” assets from 1991 to 2014 and maps the efficient frontier using historical values for return/covariance:
- SP500 = SP500 Total Return Index
- EAFE = MSCI EAFE Total Return Index
- REIT = FTSE NAREIT All Equity REITS Total Return Index
- GSCI = GSCI Index
- LTR = Merrill Lynch 7-10 year Government Bond Index
Results are gross of management fee and transaction costs and for illustrative purposes only. These are simulated performance results and do not reflect the returns an investor would actually achieve. All returns are total returns and include the reinvestment of distributions (e.g., dividends).
Over the past 20+ years, the commercial real estate market (REIT) has the highest absolute return, but with a relatively high standard deviation. Domestic equities (SP500) and international equities (EAFE) have relatively high returns and standard deviations. Long-term bonds (LTR) have the lowest standard deviation, but have relatively lower returns. Commodities (GSCI) perform the worst, with a high standard deviation and a low return.
The Mean-variance frontier (labeled: MV frontier) describes various optimal combinations of the 5 risky assets using historical data. “Optimal” combinations means that for a given risk level, the expected return is maximized. One can always create portfolios that would lie under the MV frontier, but they are considered sub-optimal because there are better risk/reward combinations on the MV frontier.
Click to enlarge. The results are hypothetical results and are NOT an indicator of future results and do NOT represent returns that any investor actually attained. Indexes are unmanaged, do not reflect management or trading fees, and one cannot invest directly in an index. Additional information regarding the construction of these results is available upon request.
Modern portfolio “works” in the sense that an investor is generally better off when they combine risky assets in a smart way and exploit the benefits of diversification (i.e., the individual asset risk/reward are all worse than the portfolios on the efficient frontier).
Expanding the Mean Variance Frontier with “Value”
In an ideal world, we could find portfolios that would expand the MV frontier and create opportunities with higher expected returns for a given level of risk. Perhaps counter-intuitively, adding highly volatile assets sometimes expands the MV frontier, if the volatility associated with the portfolio being added is unrelated to the other assets already included in the portfolio. An example of this situation is when one adds concentrated “factor” portfolios to a broader diversified portfolio. On a stand-alone basis, these concentrated exposures appear ugly, but in a portfolio context, they are much more interesting.
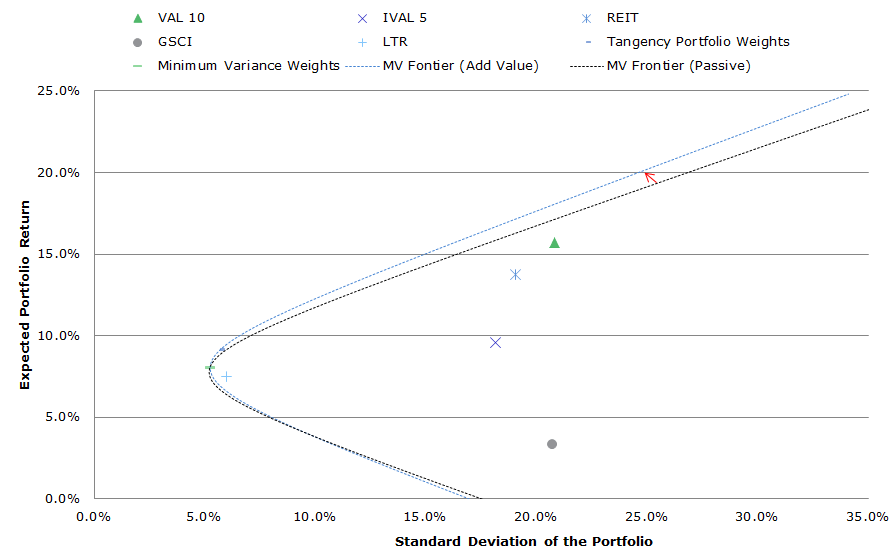
We explore this concept further by replacing the generic passive equity exposures (i.e., SP500, EAFE) in the IVY 5 with generic active value exposures. Thus, instead of exposure to the S&P 500 and EAFE, we now consider exposure to a simple “value” factor in domestic and international equity markets. We seek to identify how adding “value” to a diversified portfolio affects the efficient frontier:
- SP500 –> VAL 10 = Ken French Top Decile Value (Value-weighted portfolio)
- EAFE –> IVAL 5 = International Top Quintile Value (Average Top 3 market cap value-weight quintiles)
The chart below highlights the results. [At little later, we will examine in detail specifically how the addition of momentum affects the efficient frontier. For now, we choose to examine how our chosen active “value” allocations differ from the passive allocations, and the general effects this has had on the efficient frontier.]
VAL 10 and IVAL 5 are clearly much more volatile than the generic passive exposures. However, looking at volatility on an asset by asset basis disregards the core principles of an investment portfolio. We need to review the volatility of an asset in a portfolio context, and review how this asset expands/contracts the efficient frontier (again, we’ll see this more clearly in the chart at the bottom).
Click to enlarge. The results are hypothetical results and are NOT an indicator of future results and do NOT represent returns that any investor actually attained. Indexes are unmanaged, do not reflect management or trading fees, and one cannot invest directly in an index. Additional information regarding the construction of these results is available upon request.
Expanding the Mean Variance Frontier with “Momentum”
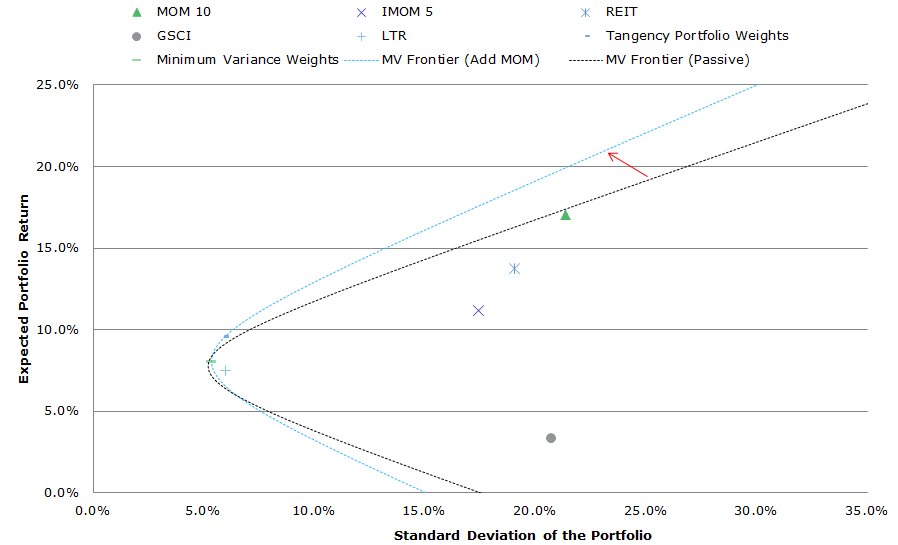
We repeat the analysis above, but we replace the generic equity exposures with generic active momentum exposures, and keep access to REITs, GSCI and LTR in our IVY 5 portfolio.
- SP500 –> MOM 10 = Ken French Top Decile Momentum (Value-weighted portfolio)
- EAFE –> IMOM 5 = International Top Quintile Momentum (Average Top 3 market cap value-weight quintiles)
Similar to the value analysis, concentrated momentum portfolios are insanely more volatile than the generic exposures, but in a portfolio context, they also expand the MV frontier.
Click to enlarge. The results are hypothetical results and are NOT an indicator of future results and do NOT represent returns that any investor actually attained. Indexes are unmanaged, do not reflect management or trading fees, and one cannot invest directly in an index. Additional information regarding the construction of these results is available upon request.
What’s the MV Frontier look like when we add Value and Momentum?
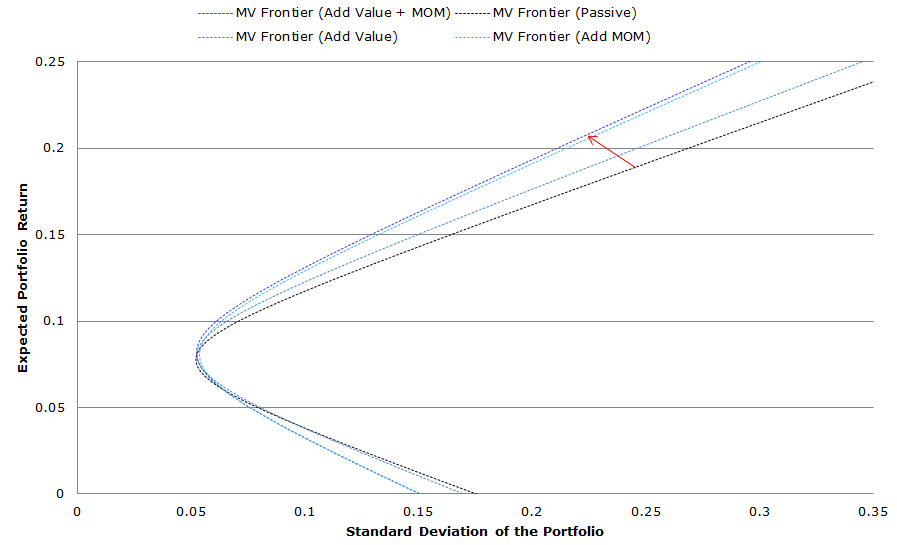
In this last part, we add both value and momentum in our portfolios. So we have 7 portfolio assets to choose from.
- SP500 –> VAL 10 and MOM 10
- EAFE –> IVAL 5 and IMOM 5
We can see below how adding concentrated value and momentum exposures expands our portfolio opportunity set. We don’t tabulate the results, but if one includes even more concentrated value and momentum exposures (which on a stand-alone basis are even more volatile than VAL/MOM 10 and IVAL/IMOM 10) the MV frontier expands even further. One can learn more about combining value and momentum here.
Click to enlarge. The results are hypothetical results and are NOT an indicator of future results and do NOT represent returns that any investor actually attained. Indexes are unmanaged, do not reflect management or trading fees, and one cannot invest directly in an index. Additional information regarding the construction of these results is available upon request.
Conclusions
When considering an investment, one should examine that decision in the context of their current portfolio, not in isolation. And as we point out above, stand-alone value and momentum exposures–especially when they are concentrated–can look horrific and are considered “career killers” by asset allocators. But these same “career killer” exposures, when viewed through the lens of a diversified portfolio, can be extremely valuable. Of course, as is the case with any investment or asset allocation framework, we must always consider the FACTS, in addition to risk/return–fees, access, complexity, taxes, and search costs.
Good luck!

About the Author: Wesley Gray, PhD
—
Important Disclosures
For informational and educational purposes only and should not be construed as specific investment, accounting, legal, or tax advice. Certain information is deemed to be reliable, but its accuracy and completeness cannot be guaranteed. Third party information may become outdated or otherwise superseded without notice. Neither the Securities and Exchange Commission (SEC) nor any other federal or state agency has approved, determined the accuracy, or confirmed the adequacy of this article.
The views and opinions expressed herein are those of the author and do not necessarily reflect the views of Alpha Architect, its affiliates or its employees. Our full disclosures are available here. Definitions of common statistics used in our analysis are available here (towards the bottom).
Join thousands of other readers and subscribe to our blog.