Ninety Years of Media Coverage and the Cross-Section of Stock Returns
- Hillert and Ungeheuer
- A version of the paper can be found here.
- Want a summary of academic papers with alpha? Check out our Academic Research Recap Category.
Abstract:
Using a novel dataset on New York Times coverage of U.S. firms from 1924 to 2013, we re-examine the relation between media coverage and stock returns. The relation between changes in media coverage and returns is consistent with an attention-driven price pressure effect: Top-quintile outperform bottom-quintile coverage-change stocks by 10.68% during the formation year. Over the next two years, these stocks underperform their counterparts by 5.04%. In contrast to previous findings, the level of media coverage positively predicts stock returns. Top-quintile outperform bottom-quintile coverage stocks by 2.76% per year. This strategy is investable, exhibits an annual portfolio turnover of only 33%, does not depend on illiquid stocks, and attains a Sharpe Ratio of 0.48 (Momentum: 0.49).
Alpha Highlight:
This paper uses a novel dataset based on New York Times coverage from 1924 to 2013 (90 years), and re-examines the relationship between media coverage and stock returns. There are multiple findings and test in the paper, but highlight the primary hypothesis the authors address:
- Does an increase in media coverage lead to temporary overvaluation?
In the paper, the authors use annual New York Times coverage as the proxy for media coverage. The data is obtained from the New York Times Chronicle webpage. The authors include all ordinary U.S. firms listed on NYSE, AMEX and NASDAQ between 1926 to 2014 in their sample and then search for firm-specific articles using historical company names.
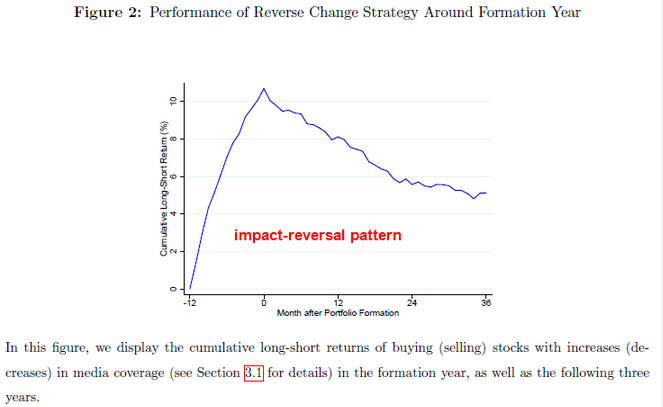
Impact-Reversal Pattern
The paper finds that stocks with a strong increase in media coverage significantly outperform stocks with a strong decrease in media coverage during the formation year. But in the subsequent two years, the results show an impact-reversal pattern.
Figure 2 displays the cumulative long-short returns of buying (selling) stocks with increases (decreases) in media coverage from the beginning of the formation year t to the end of the third year after formation t+3. In the formation year, the stocks with a strong increase in media coverage outperform stocks with a strong decrease by 10.68%. In the subsequent three years, these stocks underperform their coverage decrease counterparts by 5.04%.
The results are hypothetical results and are NOT an indicator of future results and do NOT represent returns that any investor actually attained. Indexes are unmanaged, do not reflect management or trading fees, and one cannot invest directly in an index. Additional information regarding the construction of these results is available upon request.
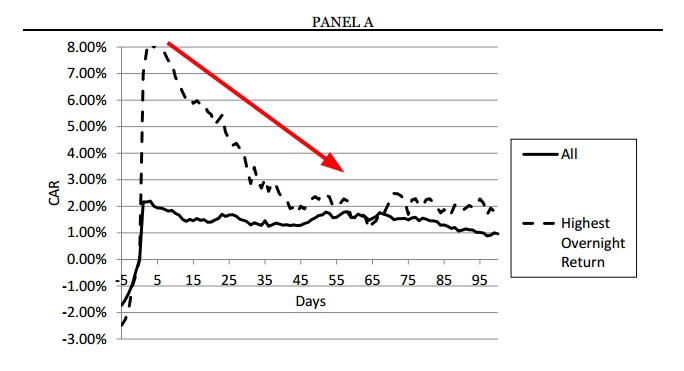
This impact-reversal pattern has been discovered in a shorter time period. Engelberg, Sasseville and Williams (2010) find that stock recommendations by Jim Cramer (Mad Money Show) lead to large overnight returns but subsequently reverse over the subsequent several months.
The results are hypothetical results and are NOT an indicator of future results and do NOT represent returns that any investor actually attained. Indexes are unmanaged, do not reflect management or trading fees, and one cannot invest directly in an index. Additional information regarding the construction of these results is available upon request.
Beware of overreaction. Dramatic increases in media coverage may attract investor attention and lead to a short-term momentum effect, but such price moves reverse over time.
We believe true momentum, which is sustained and persistent, is driven by continuous, gradual information that is only gradually reflected in stock prices. As an example, check out the Frog-in-the-pan momentum theory.

About the Author: Wesley Gray, PhD
—
Important Disclosures
For informational and educational purposes only and should not be construed as specific investment, accounting, legal, or tax advice. Certain information is deemed to be reliable, but its accuracy and completeness cannot be guaranteed. Third party information may become outdated or otherwise superseded without notice. Neither the Securities and Exchange Commission (SEC) nor any other federal or state agency has approved, determined the accuracy, or confirmed the adequacy of this article.
The views and opinions expressed herein are those of the author and do not necessarily reflect the views of Alpha Architect, its affiliates or its employees. Our full disclosures are available here. Definitions of common statistics used in our analysis are available here (towards the bottom).
Join thousands of other readers and subscribe to our blog.