Having spent what seems like a lifetime in the financial industry at this point, I’ve always had this nagging suspicion about private equity (PE): private equity investments are not special.
And I’ll take my hunch a bit further: public equity markets can deliver the same return profile as private equity.
After all, you hear so many compelling stories about PE. PE investors have an information advantage so they can see opportunities more clearly. They can specialize in industries. They can implement changes in operations that add value. They can use preferred stock and buyout protections to manage the downside. These features seem like they would give PE investors a sustainable performance edge over public equity investors.
All great stories. But are they true?
If the PE stories are true, and you invest in a portfolio of public stocks with characteristics similar to those found in PE portfolios, then returns to private equity should be higher. Put another way, if PE really has this big edge, it should be impossible to engineer a portfolio of public equities to match the performance of private equity.
What Does the Evidence Say?
We’ve already highlighted one interesting paper on this subject, but this paper goes a bit more in-depth with analysis. These papers all emphasize something we already knew and something we already leverage in our own investment processes: looking for value via enterprise multiples (i.e., EBIT/TEV) seems like a good idea. Turns out, this basic muscle movement–with a few bells and whistles attached–captures the “beta” and/or “alpha” attached to private equity returns. Professor Erik Stafford takes this analysis to a whole new level.
In “Replicating Private Equity with Value Investing, Homemade Leverage, and Hold-to-Maturity Accounting,” (a copy is here) by Erik Stafford, the author tackles my suspicions by attempting what PE investors say is the impossible: the replication of private equity returns in public markets.
The PE Benchmark – Gross and Net Returns
Stafford uses the Cambridge Associates Private Equity Index (covering 5,700 funds) as a proxy for PE returns, and examines the period from 1986 to 2014.
Stafford takes quarterly Net-of-Fee time series data from the PE Index, and adds back an assumed 2% fixed fee and a 20% performance fee to arrive at Pre-Fee returns. “Public Market” is the value-weight U.S. stock market index. “Mean Excess Returns” are measured in excess of T-bills, and are based on quarterly returns:
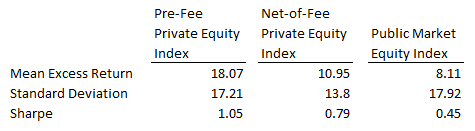
The results are hypothetical results and are NOT an indicator of future results and do NOT represent returns that any investor actually attained. Indexes are unmanaged, do not reflect management or trading fees, and one cannot invest directly in an index. Additional information regarding the construction of these results is available upon request.
In a slam dunk for PE, gross (Pre-Fee) returns are more than double public market returns, and with similar volatility. PE’s Net-of-Fee returns are also impressive, although it’s interesting that the difference between PE’s gross and net represent all-in fees of about 7%! Ouch!
Refining Asset Selection
But this is not really a level playing field, since we’re using a “dumb-dumb” passive public index. We should mimic in public markets what PE is doing privately and then compare again.
In order to identify the characteristics of firms in PE portfolios, Stafford looks at a large sample of public targets taken private by private equity firms. In general, he finds these firms tend to be small, value stocks, with low net equity issuance and modest profitability. So to replicate, Stafford simply buys small, cheap stocks, just like PE does.
Replicating with Value Stocks
For the replicating public portfolio, Stafford simply uses the cheapest EBITDA/EV decile, with equal weighting and a monthly rebalance. Over the same period as above, the public value portfolio returned an excess return of 19.5%, with annual volatility of 19.3% and a Sharpe Ratio of 1.01.
Gee, that’s interesting. A simple value strategy seems to offer a higher gross return than PE, although with a bit more risk, so it has a slightly lower Sharpe Ratio.
PE Return Smoothing
Although this finding is remarkable, it was only as I got farther into the paper that I realized what Stafford was really driving at with his analysis—the impact of “return smoothing.”
Stafford points out that there is a lot of evidence (such as here and here) that in the hedge fund world, when reporting returns, funds “manage” prices (say, of illiquid or OTC securities), allowing them to understate their true market exposure. Since a PE portfolio consists entirely of private companies, in PE you might reasonably expect to see even more such “return smoothing,” which artificially lowers measured volatility.
There is some evidence that this is the case. The paper references a 2009 Forbes article (a copy is here) that describes how when the Harvard Endowment liquidated one large private equity position during the financial crisis, they sold at 60 cents on the dollar. Why didn’t they get the NAV as reported by the PE firms? According to the investment bank advising Harvard at the time: “…the big discounts are due to ‘unrealistic pricing levels at which funds continued to hold their investments’ and ‘fantasy valuations.’” The article went on to describe a publicly traded fund-of-funds in Harvard’s portfolio that was trading at a 62% discount to NAV.
So let me get this straight. The PE shops said the book was worth $1.00, but the public markets said it was worth $0.38? Sounds a lot like return smoothing to me.
Let’s Throw in Some Leverage and Try Some Return Smoothing of Our Own
PE transactions usually add substantial leverage to firms, and Stafford attempts to match their post-LBO leverage by using modest amounts (2X) of brokerage margin (or “homemade” leverage) in another public value stock portfolio; this approximates PE’s post-LBO leverage ratios.
Stafford investigates smoothing by using a hold-to-maturity approach for public portfolio stocks, where stocks are marked at cost, but portfolio NAV changes are based on realized profits and losses (cash flows) when positions are liquidated. This is similar to “hold-to-maturity” accounting for U.S. banks. For this replication, he uses public value stocks from the cheapest 3 deciles, and holds for four years. This way, he mimics PE’s longer holding period and discretion on NAV valuation, which minimizes the impact of short term price moves.
If instead of this approach you use public mark-to-market accounting, this strategy has high returns of 21%, but is very risky, with volatility of 36%, and suffers massive 90% max drawdowns.
However, using hold-to-maturity accounting, the levered value portfolio excess returns shrink to 15.8%, but with annual volatility of only 8.2% and a spectacular Sharpe Ratio of 1.94. The max drawdown was a mere 15%. This hold-to-maturity return accounting methodology completely hides the underlying volatility!
So if you put this in a powerpoint and subtracted a hefty 1-2% management fee from performance, the results would still trounce PE’s Net-of-Fee returns from above, and with much lower risk. Would you be a buyer?
Ok, ok, perhaps this version of “return smoothing” goes too far and gives public equity an unfair advantage. But that’s not really the point here. The point is to get investors focused on return smoothing itself, and why it matters for assessing PE’s performance.
From the paper:
These results clearly do not establish that private equity returns have distorted risks because of discretion in the marking of the net asset value, but do demonstrate that discretion in marking the portfolio net asset value can eliminate most of the measured risk. Moreover, this is a legitimate portfolio marking rule that is supported by market regulators for firms that are identified as systematically important for financial stability.
I also thumbed through David Swenson’s “Pioneering Portfolio Management,” which was published in 2000, and found this quote:
…the low risk evident in data describing past returns from private investing constitutes a statistical artifact…If two otherwise identical companies differ only in the form of organization—one private, the other public—the infrequently valued private company appears much more stable than the frequently valued publicly traded company. Although both companies react in identical fashion to fundamental drivers of corporate value, the less volatile private entity boasts superior risk characteristics, based solely on mismeasurement of the company’s true underlying volatility.
So clearly Stafford’s basic insight is not new, although the research illuminates it in new ways.
Indeed, generically speaking, how meaningful is it to claim some performance advantage over public markets when you use leverage to buy small, cheap private companies, and exercise substantial discretion in measuring NAV? And then to say this “advantage” justifies an all-in ~7% fee?
For me anyway, this paper raises a number of new questions regarding the value to investors of PE as an asset class. Caveat emptor!
In the meantime, for my own “private equity” exposure I’ll stick to the Quantitative Value algorithm, which buys the cheapest, highest quality stocks.

About the Author: David Foulke
—
Important Disclosures
For informational and educational purposes only and should not be construed as specific investment, accounting, legal, or tax advice. Certain information is deemed to be reliable, but its accuracy and completeness cannot be guaranteed. Third party information may become outdated or otherwise superseded without notice. Neither the Securities and Exchange Commission (SEC) nor any other federal or state agency has approved, determined the accuracy, or confirmed the adequacy of this article.
The views and opinions expressed herein are those of the author and do not necessarily reflect the views of Alpha Architect, its affiliates or its employees. Our full disclosures are available here. Definitions of common statistics used in our analysis are available here (towards the bottom).
Join thousands of other readers and subscribe to our blog.