Quantifying Backtest Overfitting in Alternative Beta Strategies
- Antti Suhonen, Matthias Lennkh, and Fabrice Perez
- A version of the paper can be found here.
- Want a summary of academic papers with alpha? Check out our Academic Research Recap Category.
Abstract:
We investigate the biases in the backtested performance of “alternative beta” strategies using a sample of 215 commercially promoted trading strategies across five asset classes. Our results lend support to the cautions in recent literature regarding backtest overfitting and lack of robustness in trading strategy performance during the ”live” period (out of sample). We report a median 73% deterioration in Sharpe ratios between backtested and live performance periods for the strategies in our sample. We establish a link between performance deterioration and strategy complexity, with the realized reduction in live vs. backtested Sharpe ratios of the most complex strategies exceeding those of the simplest ones by over 30 percentage points. The robustness of strategy exposure to risk factors varies between asset classes and strategies, and appears reasonable in equity volatility and FX carry strategies, but quite weak in the equity value strategy in particular.
Alpha Highlight:
This paper investigates the backtested and subsequent live performance of alternative beta funds. To be clear, the researchers don’t study “smart beta” products, which in general are long-only investment products, often in equities, that use different weighting schemes relative to a passive index. By contrast, “alternative beta” strategies focus on risk premiums across multiple asset classes, might go long and short, and have low correlations with traditional investments.
In theory, alternative beta sounds great, but the proof is in the pudding: Do the theoretical factor exposures really provide the hoped-for returns once they go live? Are these robust, sustainable strategies? Or are we just “factor fishing?” The authors examine 215 alternative beta strategies across 5 asset classes from 15 investment banks.
The authors describe their sample selection process below:
-
Investment bank-sponsored alternative beta strategies are formulaic and non-discretionary strategies that follow set investment rules (asset selection, rebalancing, execution, risk management etc.) that typically cannot be changed by the index sponsor after the live date.
-
Upon the release of a new alternative beta strategy, the sponsoring investment bank will provide investors with a backtested time series illustrating the hypothetical past performance of the proposed strategy. Given the immutability of the strategy rules, there is some justification in arguing that this past performance would have some value in assessing the future behavior of the strategy.
-
Our sample contains the daily backtested (pre-live date) performance of each strategy, the daily live (post-live date) performance, as well as the exact live date as reported by the strategy sponsor. The average length of the backtest periods is 10.7 years and that of the live periods is 4.6 years, allowing reasonable statistical analysis.
This is an interesting sample to analyze. Providers create a strategy, show the backtest (which often look good), and then launch a product to armies of advisors. Rinse and repeat. We have written about this activity within the context of ETFs and here is a paper on mutual funds. This paper adds to the literature by investigating alternative beta strategies.
So what happens after the fund launches?
Similar to the other research in ETFs and Mutual Funds, the data shows a significant dropoff in performance:
We find a median Sharpe ratio (SR) of 1.20 across the 215 alternative beta strategies during their respective backtest periods, compared to 0.31 during live performance.
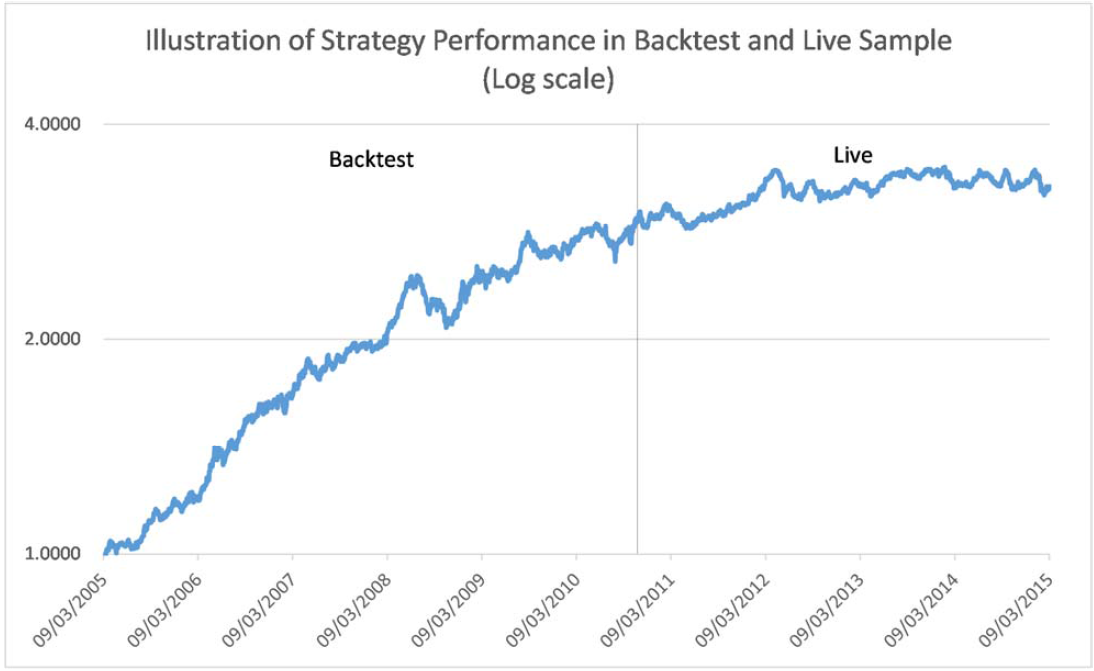
Here is a visualization of Figure 1 from the paper that makes this even more clear:
Figure 1 below illustrates our key findings. The figure shows the backtested and live performance (excess return index) of one alternative beta strategy in the sample over a ten-year period, with the vertical line in October 2010 marking the live date of the strategy. The strategy is representative of the median in our sample, with a backtested SR of 1.42 and live SR of 0.36, or a realized SR haircut of 75%.
The results are hypothetical results and are NOT an indicator of future results and do NOT represent returns that any investor actually attained. Indexes are unmanaged, do not reflect management or trading fees, and one cannot invest directly in an index. Additional information regarding the construction of these results is available upon request.
Additionally, the authors make some recommendations for business practices around alternative beta. For instance, they point out that when examining strategy returns on Bloomberg, it is often difficult to identify when a backtest ends and live trading begins. Also, they suggest that banks supply hypothetical returns under different combinations of strategy parameters. This can provide insight into a strategy’s robustness.
Conclusion:
Overall, the paper highlights an important lesson for all investors — before investing in the new alternative product with the great backtest (because they always do), ask whether or not the strategy has sustainable edge/alpha.

About the Author: Jack Vogel, PhD
—
Important Disclosures
For informational and educational purposes only and should not be construed as specific investment, accounting, legal, or tax advice. Certain information is deemed to be reliable, but its accuracy and completeness cannot be guaranteed. Third party information may become outdated or otherwise superseded without notice. Neither the Securities and Exchange Commission (SEC) nor any other federal or state agency has approved, determined the accuracy, or confirmed the adequacy of this article.
The views and opinions expressed herein are those of the author and do not necessarily reflect the views of Alpha Architect, its affiliates or its employees. Our full disclosures are available here. Definitions of common statistics used in our analysis are available here (towards the bottom).
Join thousands of other readers and subscribe to our blog.