Intermediate-Term Price momentum, originally researched by Jegadeesh and Titman in 1993, documented a how recent stock returns tended to continue in the future. Stocks that were past winners (on average) continue to do well, while stocks that were past losers (on average) continue to perform poorly.
A natural inclination is to create a long-short portfolio to take advantage of this — buy the past winners and sell the past losers. Sounds like a great idea! On average, this is a good bet; however this strategy will crash from time-to-time, as shown by academics here. Sometimes the past winners perform poorly, while past losers perform well. And these crashes can be horrific — extreme events that persist over time. Wouldn’t it be great if there were some way to mitigate these crashes?
The authors of this paper decided to just that, by using simple stop-loss rules in an attempt to minimize the crashes. The rules are simple:
- Rebalance the long and short book monthly
- If a long position declines by 10% (or 5%), sell the position and stay in cash/RF until the end of the month.
- If a short position increases by 10% (or 5), cover the short and stay in cash/RF until the end of the month.
Hmm, stop loss rules. Do these work? According to the paper, YES! The largest monthly drawdown decreases from -49.79% to -11.36%, using equal-weight portfolios, and from -64.97% to -23.28% using value-weight portfolios.
Here is Table 1 from their paper:
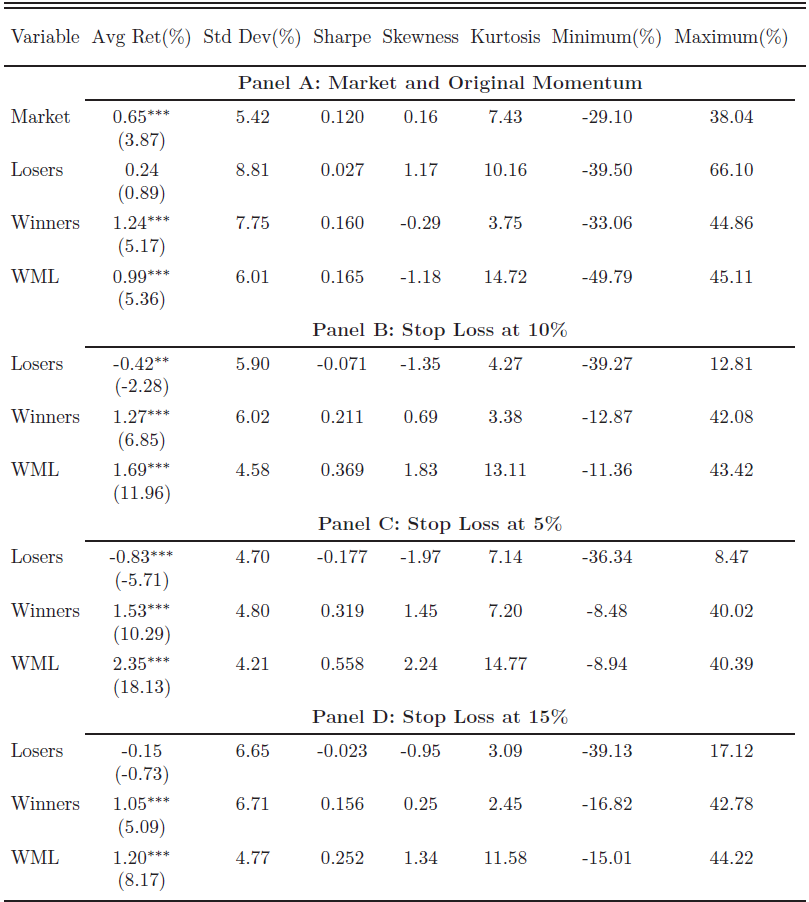
Click to enlarge. The results are hypothetical results and are NOT an indicator of future results and do NOT represent returns that any investor actually attained. Indexes are unmanaged, do not reflect management or trading fees, and one cannot invest directly in an index. Additional information regarding the construction of these results is available upon request.
Clearly the average returns increase with the use of the stop-loss rules. If we examine the WML (Winners Minus Losers) rows, the average monthly returns appear to be the highest when using the 5% rule.
Our Analysis
First, this strategy requires daily analysis of every stock position and may be difficult for the average investor to implement. Second, if one examines the average returns to the winning stocks above, you see that the 10% stop-loss rule has a similar return to the simple momentum strategy (1.27% vs 1.24%) while the 15% rule is actually worse than the simple momentum strategy (1.20% vs 1.24%). The 5% stop-loss rule works the best on the winner portfolio, with an average return of 1.53%.
Another consideration is that the paper includes all stocks, including micro-cap securities which tend to make up ~50% of the stocks in the universe. For various reasons these stocks pose practical implementation problems, notably liquidity issues.
So we decided to do some analysis, and focused on what we consider to be mid to large-cap stocks, where these practical micro-cap issues are mitigated, and which represent all common stocks above the NYSE 40th percentile for market capitalization. Additionally, since shorting also poses certain practical challenges, we only examine the long-leg of the strategies below.
Here are the four portfolios that we examine:
- MOM 10 EW Monthly: Top 10% of firms ranked on their past momentum (total return over the past 12 months ignoring last month). Portfolio is monthly-rebalanced and equal weighted.
- MOM 10 EW (Daily 10% Stop Loss): Top 10% of firms ranked on their past momentum (total return over the past 12 months ignoring last month). Portfolio is monthly-rebalanced and equal weighted. If during the month any individual stock position is down 10%, sell the security on the day the rule is triggered and remain in cash until the end of the month, at which time the portfolio is rebalanced into the top 10% of momentum firms.
- MOM 10 EW (Daily 5% Stop Loss): Top 10% of firms ranked on their past momentum (total return over the past 12 months ignoring last month). Portfolio is monthly-rebalanced and equal weighted. If during the month any individual stock position is down 5%, as with the above rule, sell the security and remain in cash until the end of the month, at which time the portfolio is rebalanced into the top 10% of momentum firms.
- SP500 EW: Total return to the S&P 500, equal-weighted.
In the results below, all returns are gross, and no management fee or transaction costs are applied:
Returns from 1/1/1927 – 12/31/2013:
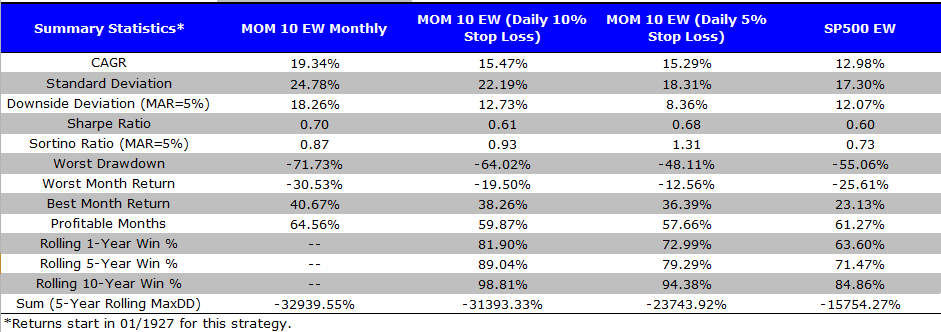
Click to enlarge. The results are hypothetical results and are NOT an indicator of future results and do NOT represent returns that any investor actually attained. Indexes are unmanaged, do not reflect management or trading fees, and one cannot invest directly in an index. Additional information regarding the construction of these results is available upon request.
What do you notice? While the simple, long-only portfolio performs better when comparing GAGR and Sharpe ratios, the 5% and 10% stop-loss rule portfolios have lower drawdowns and higher Sortino ratios. So are you ready to apply stop-loss rules? Before making a judgment, consider AN IMPORTANT CAVEAT — these returns are gross of fees. Column 1 is monthly rebalanced, while columns 2 and 3 are rebalanced monthly with additional intra-month trading daily. This adds significant transaction costs. So what’s the effect? Trying to figure out the trading costs on these strategies would be a huge research paper unto itself, but it certainly raises questions. Anyone seriously considering this strategy would probably want to take 300-600bps off the strategies (especially going back to 1927). That might eliminate all the benefits of the risk management strategy.
Overall, the stop-loss rules can help with drawdowns, but will cause more trading, thus adding expense and reducing performance. Also, the added complications involved in running a short book would increase complexity. As with many strategies coming out of academia that look great at first glance, the devil is clearly in the details.
Let us know your thoughts. You can learn more about our thoughts on momentum investing here.
Taming Momentum Crashes: A Simple Stop-Loss Strategy
- Han, Zhou, and Zhu
- A version of the paper can be found here.
- Want a summary of academic papers with alpha? Check out our Academic Research Recap Category.
Abstract:
In this paper, we propose a stop-loss strategy to limit the downside risk of the well-known momentum strategy. At a stop-level of 10%, we find, with data from January 1926 to December 2013, that the maximum monthly losses of the equal- and value-weighted momentum strategies go down from -49.79% to -11.36% and from -64.97% to -23.28%, while the Sharpe ratios are more than doubled at the same time. We also provide a general equilibrium model of stop-loss traders and non-stop traders and show that the market price differs from the price in the case of no stop-loss traders by a barrier option.

About the Author: Jack Vogel, PhD
—
Important Disclosures
For informational and educational purposes only and should not be construed as specific investment, accounting, legal, or tax advice. Certain information is deemed to be reliable, but its accuracy and completeness cannot be guaranteed. Third party information may become outdated or otherwise superseded without notice. Neither the Securities and Exchange Commission (SEC) nor any other federal or state agency has approved, determined the accuracy, or confirmed the adequacy of this article.
The views and opinions expressed herein are those of the author and do not necessarily reflect the views of Alpha Architect, its affiliates or its employees. Our full disclosures are available here. Definitions of common statistics used in our analysis are available here (towards the bottom).
Join thousands of other readers and subscribe to our blog.