The academic standard for intermediate-term momentum measurement is “12_2 momentum:” simply sort all stocks based on a stock’s total return over the past twelve months, ignoring the last month. (a discussion is here and here)
However, a few years ago Robert Novy-Marx wrote a paper titled “Is Momentum Really Momentum?” Given its provocative title, this paper caught our attention! Why would momentum not really be momentum?
The abstract of the paper is as follows:
Momentum is primarily driven by firms’ performance 12 to seven months prior to portfolio formation, not by a tendency of rising and falling stocks to keep rising and falling. Strategies based on recent past performance generate positive returns but are less profitable than those based on intermediate horizon past performance, especially among the largest, most liquid stocks. These facts are not particular to the momentum observed in the cross section of US equities. Similar results hold for momentum strategies trading international equity indices, commodities, and currencies.
The Novy-Marx paper was published in 2012 in the Journal of Financial Economics (JFE), one of the top finance journals. We reverse engineered Novy-Marx’s results a long-time ago and found that the 12_2 momentum was, from our perspective as long-only momentum investors, very similar to 12_7 momentum.
Click to enlarge. The results are hypothetical results and are NOT an indicator of future results and do NOT represent returns that any investor actually attained. Indexes are unmanaged, do not reflect management or trading fees, and one cannot invest directly in an index. Additional information regarding the construction of these results is available upon request.
A more recent paper written by Amit Goyal and Sunil Wahal, titled “Is Momentum an Echo?” also questions the 12_7 momentum variable proposed by Novy-Marx. This paper was published in 2015 in the Journal of Financial and Quantitative Analysis (JFQA), another top-tier finance journal. The abstract is found below:
In the United States, momentum portfolios formed from 12 to 7 months prior to the current month deliver higher future returns than momentum portfolios formed from 6 to 2 months prior, suggesting an “echo” in returns. In 37 countries excluding the United States, there is no robust evidence of such an echo. In portfolios that combine securities in developed and emerging markets, or across three major geographic regions (Americas excluding United States, Asia, and Europe), there is also no evidence of an echo. Any echo in the United States appears to be driven largely by a carryover of short-term reversals from month −2.
In other words, the results from 12_7 are not robustly different than 12_2.
The paper goes on to test Novy Marx’ hypothesis in other countries. Directly from the paper:
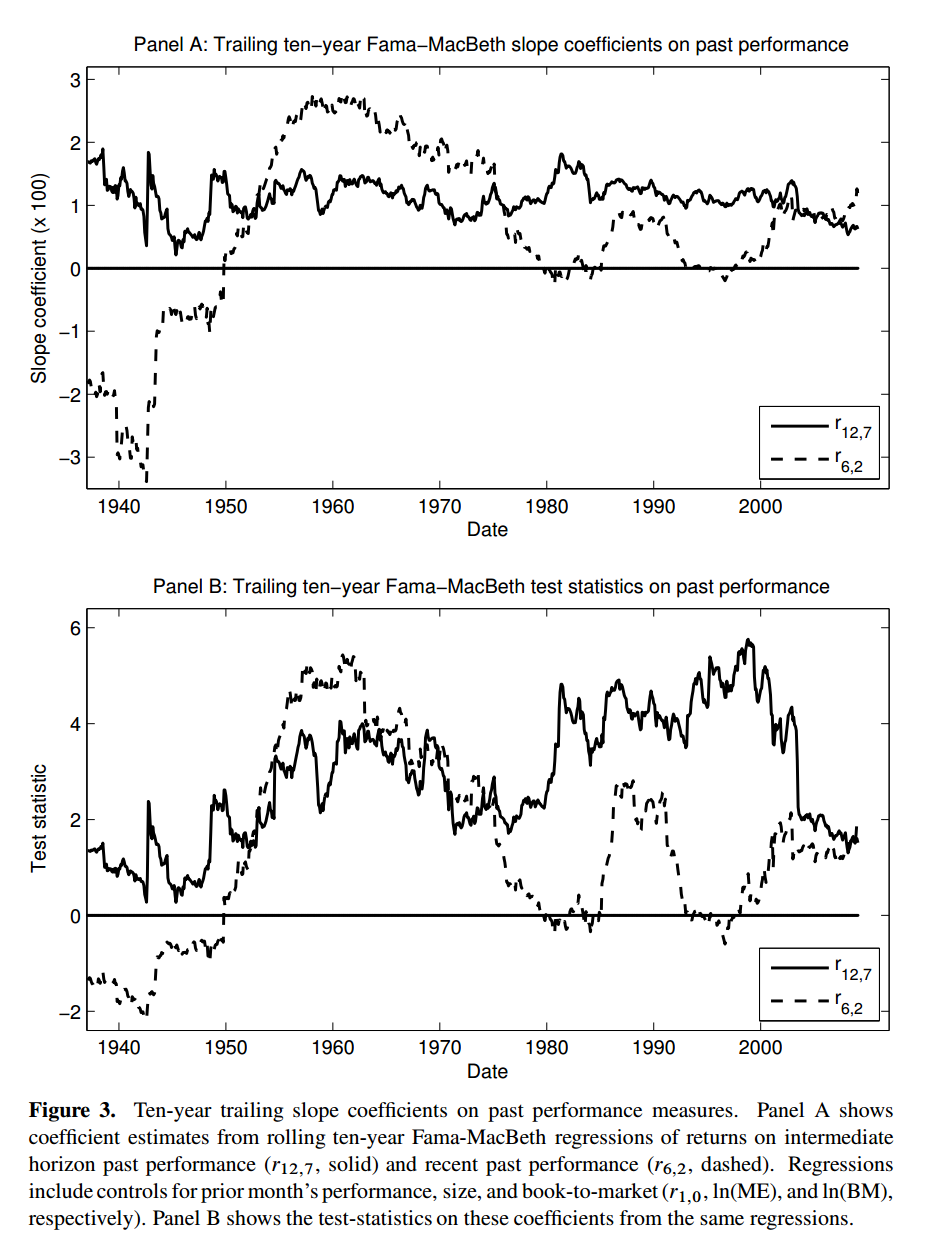
… The most recent contribution to this area comes from Novy-Marx (2012). His rather striking finding is that portfolios formed from sorting on returns from 12 to 7 months prior (intermediate horizon returns, hereafter denoted IR) predict average future returns better than portfolios formed from sorting on returns from 6 to 2 months prior (recent horizon return portfolios, hereafter denoted RR). The magnitude of the difference in profits from IR versus RR strategies is as much as 0.50% per month, which Novy-Marx argues can make an enormous difference in overcoming transaction costs incurred during implementation. More importantly, this “echo,” rather than a continuation in returns, challenges theory and effectively leaves it flat-footed (no model predicts such a term structure) and Novy-Marx himself does not present an explanation for the result.
It is conventional to perform out-of-sample tests to establish the veracity of such provocative results. One way to do this is to examine different sample periods. For example, Jegadeesh and Titman (2001) look for momentum between 1990 and 1998 to establish the out-of-sample reliability of their original results (which are based on data from 1965 to 1989). Novy-Marx (2012) looks at various subperiods and finds that the echo in returns occurs during most (but not all) of his sample period. Another approach is to see if the phenomenon occurs in other markets. Indeed, virtually every major “fact” in cross-sectional asset pricing (such as the value premium or momentum) is established by both U.S. and international evidence. Novy-Marx examines the term structure of momentum returns in commodities, currencies, and international (country) indices. He argues that although a few of these tests are not independent, the fact that the same patterns appear in these indices suggests that the echo is genuine. This apparent robustness, together with the lack of rational or behavioral intuition for why there might be an echo, makes the result puzzling.
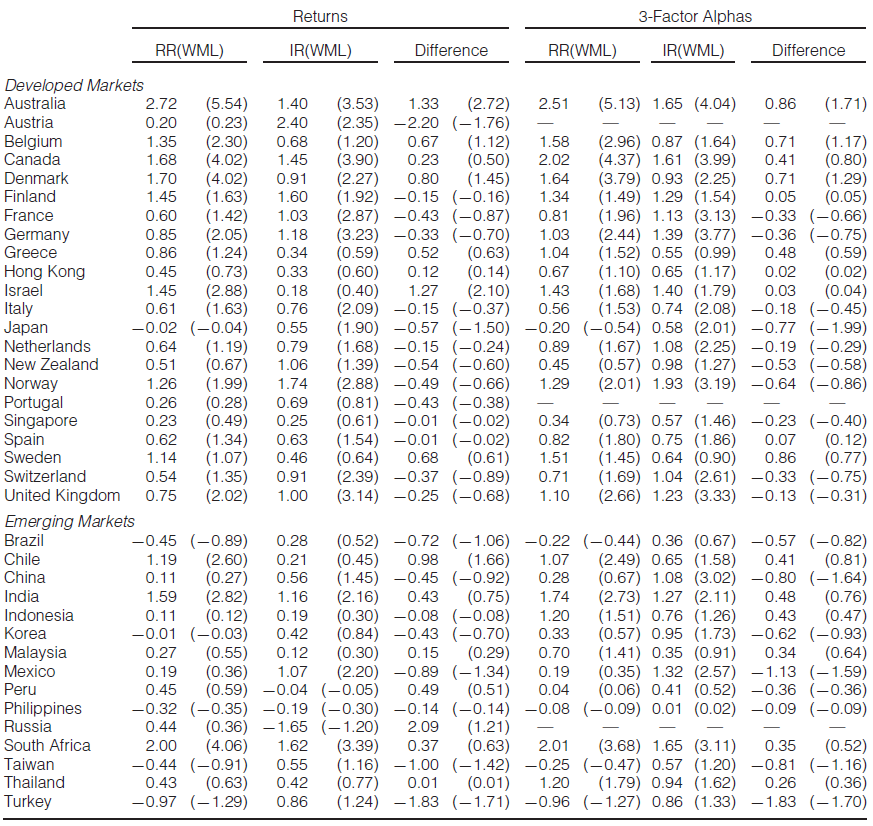
As a true out-of-sample test, we examine the term structure of momentum across stocks in 37 countries between 1980 and 2010. We create winner-minus loser (WML) portfolios defined separately over IR and RR for each country. Future monthly returns and 3-factor alphas for IR portfolios are largely indistinguishable from RR portfolios for all 37 countries. Because the number of stocks and market capitalization of some countries can be small, power can be a concern. We combine firm-countries in a variety of ways, equal or value weighting countries, and pooling securities from various countries into five aggregated portfolios: developed markets, emerging markets, Americas excluding United States, Asia, and Europe. In these more powerful portfolio tests, there is still no robust evidence that IR portfolios deliver returns that are different from those of RR portfolios.
As shown below, the authors conduct tests in numerous countries:
The results are hypothetical results and are NOT an indicator of future results and do NOT represent returns that any investor actually attained. Indexes are unmanaged, do not reflect management or trading fees, and one cannot invest directly in an index. Additional information regarding the construction of these results is available upon request.
The Table above demonstrates that Goyal and Wahal found no statistically significant differences in alphas between RR and IR in 36 of the 37 countries they examined (Japan is the one exception).
After a lot of additional analaysis, the paper concludes with the following:
Novy-Marx (2012) provides startling evidence that in the United States, momentum portfolios formed on the basis of returns from 12 to 7 months prior to portfolio formation have substantially higher profits than momentum portfolios formed based on returns from 6 to 2 months prior. These results, reminiscent of an echo, appear remarkably robust, present in different subperiods, in different groups of stocks and industries, and in size and book-to-market portfolios. Similar effects appear to exist in currencies, commodities, and international equity indices. What does one make of this? It is hard to imagine a story that could generate such an effect on prices; even the age-old “relative strength” trading strategies of Wall-Street lore have nothing to say about such an effect. For financial economists, the challenge to theory is enormous. No existing theory, whether behavioral or rational, predicts an echo in returns.
We conduct out-of-sample and in-sample tests to assess whether this predictability is genuine. We look for the same echo in regions and in 37 individual countries. We do not find convincing evidence of an echo outside the United States. Within the United States, an examination of the full term structure of returns suggests that the superior performance of strategies based on IR is driven by the presence of reversal (or at least no continuation) from month −2 returns. The true puzzle is not why IR forecast future returns better than RR, but why return reversals from month −1 also extend (somewhat) to month −2.
Overall, the authors definitely appear to disagree on the findings. Our view is that 12_2 momentum is still a great starting point for a long-only momentum investor and we incorporate this fact in our quantitative momentum philosophy.
Let us know what you think!

About the Author: Jack Vogel, PhD
—
Important Disclosures
For informational and educational purposes only and should not be construed as specific investment, accounting, legal, or tax advice. Certain information is deemed to be reliable, but its accuracy and completeness cannot be guaranteed. Third party information may become outdated or otherwise superseded without notice. Neither the Securities and Exchange Commission (SEC) nor any other federal or state agency has approved, determined the accuracy, or confirmed the adequacy of this article.
The views and opinions expressed herein are those of the author and do not necessarily reflect the views of Alpha Architect, its affiliates or its employees. Our full disclosures are available here. Definitions of common statistics used in our analysis are available here (towards the bottom).
Join thousands of other readers and subscribe to our blog.