The dot-com bubble of the late 90s was a wild time in the stock market. Internet stocks were trading through the roof, tech IPOs were a practically daily experience, and people quit their jobs to make millions day trading.
And why not?
Even a day trading chimp could make money in a market that went up every day.
The money flowed like water. In January 2000, just before the bubble popped, Superbowl XXXIV featured advertisements from 14 dot-coms founded during the bubble, who paid an average of $2.2 million per 30-second spot. The internet land grab was in full swing. It was a new era, and the old valuation paradigms did not apply. Growth stocks took off, and value stocks languished.
We wrote here about how, during the late 90s large-cap growth soundly beat small-cap value, even though the fundamentals seemed to moving in opposite directions, weakening for large-cap growth and strengthening for small-cap value. The world seemed like it had been turned upside down. Value investing no longer worked.
On December 27, 1999, Barron’s published a piece entitled, “What’s Wrong, Warren?” which suggested “Warren Buffett may be losing his magic touch.” Value investing’s famous friend was on the hot seat.
The below graph plots the time period 6/30/98 through 2/29/00 for the Nasdaq, where many dot-com and technology stocks traded, and the price of Berkshire Hathaway, Warren Buffett’s holding company, which consisted of value stocks:
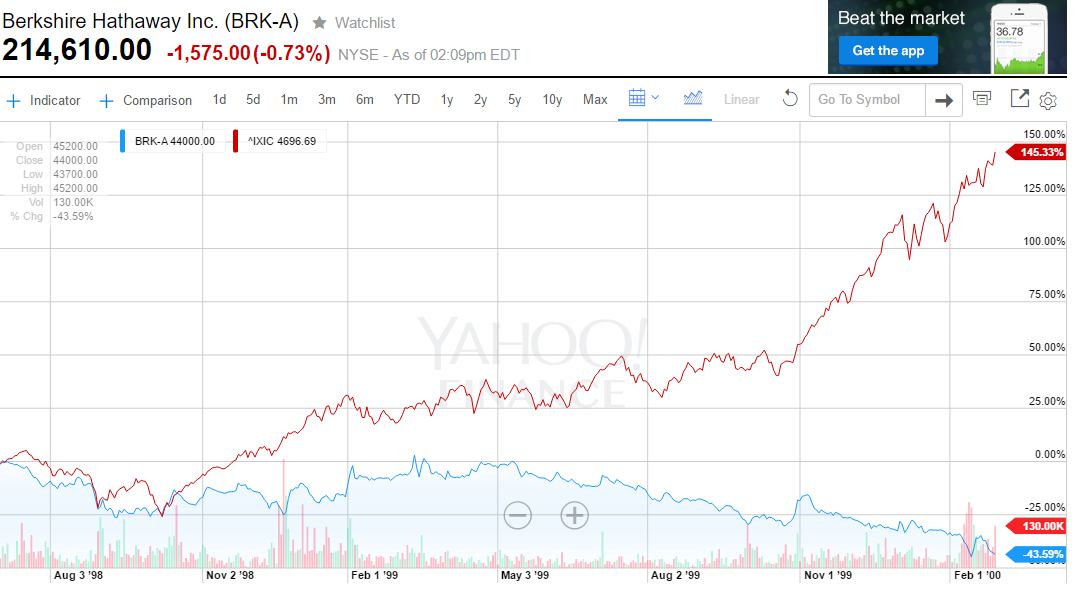
It was rough sledding for Buffett. The Nasdaq was up 145%, while Berkshire was down 44% — a mind-bending 189% streak of underperformance for the oracle of Omaha, at least versus Nasdaq’s growth-oriented technology stocks.
There’s a funny feature of the graph above. Note that, as the Nasdaq’s growth took off, going higher and higher in late ’99 and early ‘00, Buffett’s underperformance only seems to accelerate. It’s almost as if investors were selling Buffett’s value stocks in order to buy internet stocks.
Now let’s also look at the aftermath of the bubble. The graph below is of the period 1/1/99 through 12/31/00, and again plots the Nasdaq against Berkshire:
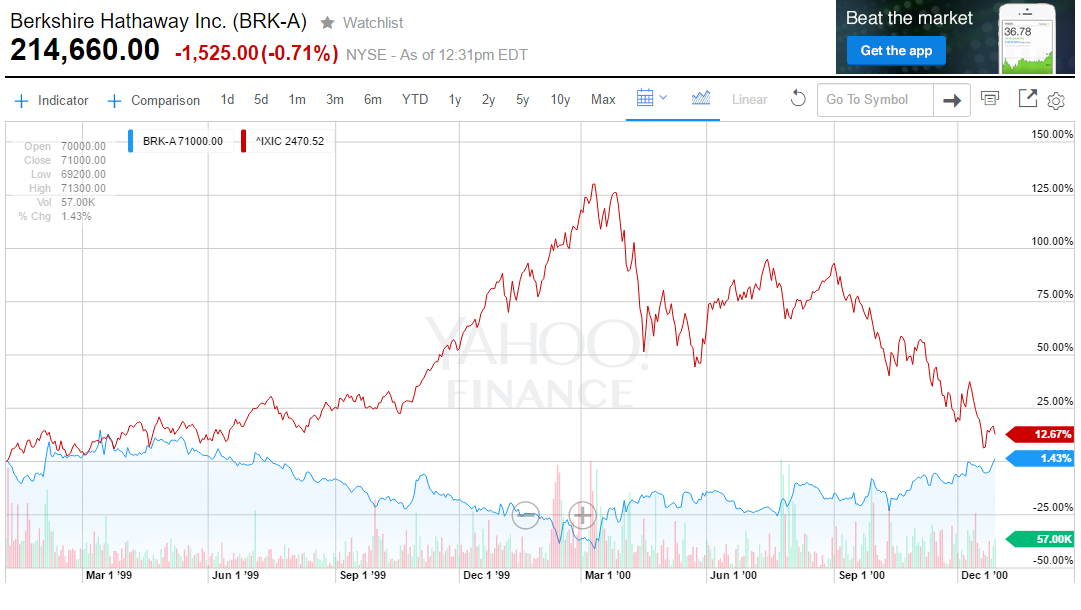
Source: Yahoo Finance
Now we can also see what happened after the peak: It appears that as the Nasdaq collapsed, Buffett’s performance seemed to accelerate. The opposite effect seemed to be occurring: Were investors dumping internet stocks, and buying Buffett’s value stocks?
The Academic Geeks Enter the Debate
There has been a good deal of research into how traders interact in markets, and some of this has occurred in laboratory settings.
We examined one such laboratory-based approach in a piece based on a paper by Caginalp, Porter and Smith, which discussed Recreating Asset Bubbles in the Laboratory, and how the psychology of momentum may play a role in bubbles. It turns out Caginalp and his colleagues really love the laboratory.
So they went back to it.
In “Do Speculative Stocks Lower Prices and Increase Volatility of Value Stocks?” by Caginalp, Illeva, Porter and Smith, the authors became interested in how traders interact in “two-tiered” market environments, such as that characterized by the value and tech stock/growth dichotomy observed during the dotcom bubble.
The authors wondered whether it was true that the presence of a speculative stock might tend to pull capital away from value assets. Put another way, when speculative stocks get bid up, do value stocks trade down? This also suggests a related question: If a speculative stock appreciates, does this make a value stock alternative more volatile?
The experiment is set up as a 42 minute trading period, with prices updated every 2 minutes. The market consists of two assets: 1) Value A, which is a value stock, and 2) Speculative B, which is a speculative growth stock.
The Value Investing Asset
The value stock began the experiment with an expected payout of 100 francs. At each 2-minute update (similar to an earnings announcement), this terminal value would be adjusted – either up by 4%, or down by 1%. The price path for the value stock was a fairly smooth, reflecting its consistent “earnings” growth, and with an upward trajectory over the trading period.
The Speculative Investing Asset
The speculative stock also began with an expected payout of 100 francs. However, the earnings announcements (terminal value “adjustments”) were either up 10%, up 1%, or down 6%. This was more volatile growth that for the value asset. Furthermore, the authors engineered the trading period so that the speculative stock had “good” earnings draws early, up to the 26th minute, but more “poor” earnings draws in minutes 27 through 42. This experimental design feature was meant to mimic the inflation of the dotcom bubble, and its subsequent deflation.
A typical trading period might exhibit price paths seen in the graph below:
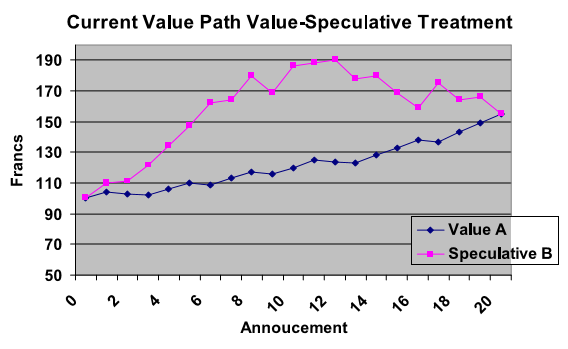
The results are hypothetical results and are NOT an indicator of future results and do NOT represent returns that any investor actually attained. Indexes are unmanaged, do not reflect management or trading fees, and one cannot invest directly in an index. Additional information regarding the construction of these results is available upon request.
Next the authors ran another series of trading experiments, but in these cases they used two value stocks. A typical trading session is reflected in this graph:
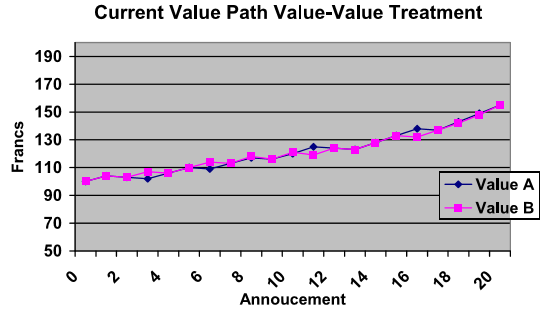
The results are hypothetical results and are NOT an indicator of future results and do NOT represent returns that any investor actually attained. Indexes are unmanaged, do not reflect management or trading fees, and one cannot invest directly in an index. Additional information regarding the construction of these results is available upon request.
The researchers wanted to compare the trading history of Asset A (which was always a value asset) under two conditions: 1) Asset B was a speculative asset, and 2) Asset B was another value asset. By running regressions on how Asset A behaved under these two conditions, the authors hoped to find evidence that the presence of the speculative asset depressed prices for the value asset, and increased its volatility.
What Does the Evidence Say?
The authors find that speculative assets depress value prices and increase volatility, but the statistical evidence was not overwhelming. In the linear regression the authors used the price of Asset A (always value) as the dependent variable, and an “S” as a binary independent variable that related to the presence or absence of the speculative asset. They also regressed S against the volatility of Asset A as the dependent variable.
Bubble Inflation
The first period covered the run-up to the speculative market “peak” in the 26th minute. In this price regression the S coefficient had a p-value of 0.10, while in the volatility regression they found S had a p-value of 0.233. While neither of these p-values meets traditional statistical significance thresholds, the price regression in particular looks reasonable.
Bubble Deflation
Next, the second period covered the “bursting” of the speculative bubble, from the 27th minute through the 42nd minute. For this period, the price regression had a p-value of 0.21, and the volatility regression also had a p-value of 0.21. Again, neither test is statistically significant, and thus not a “slam dunk” rejection of the null hypothesis (i.e., there is no effect), the results provide some statistical support for the idea that a speculative asset does suppress the trading price of a value asset, and increases its volatility.
Conclusions
Below are some selected quotes from the paper that sum up these findings:
The momentum of the speculative asset induces more to buy into the rally, and leaves fewer assets to bid for the value asset. Analogously, one would expect higher prices [for the value asset] during the decline of the speculative market…Our results indicate the trading prices of asset A are generally lower and more volatile when asset B is a speculative stock…These experiments…lend further support to…arguments suggesting that money flowing to one asset tends to suppress the trading price of the other.
While this language is pretty explicit regarding the conclusions we can draw from the evidence, in the end the p-values are not that impressive, and the data are pretty noisy. Yet laboratory settings for experiments that test for specific trading interactions are going to offer inherently imperfect insights into effects observed in broader markets.
Although this experiment didn’t offer compelling statistical evidence, I think the authors’ conclusions are a plausible explanation for what happened to value investors during the dotcom bubble. Certainly what happened to Berkshire Hathaway during the dotcom boom seems consistent with this.
I look forward to seeing more research along these lines and anything related to value. As many already know, value investing is a great idea, but a difficult style to follow!

About the Author: David Foulke
—
Important Disclosures
For informational and educational purposes only and should not be construed as specific investment, accounting, legal, or tax advice. Certain information is deemed to be reliable, but its accuracy and completeness cannot be guaranteed. Third party information may become outdated or otherwise superseded without notice. Neither the Securities and Exchange Commission (SEC) nor any other federal or state agency has approved, determined the accuracy, or confirmed the adequacy of this article.
The views and opinions expressed herein are those of the author and do not necessarily reflect the views of Alpha Architect, its affiliates or its employees. Our full disclosures are available here. Definitions of common statistics used in our analysis are available here (towards the bottom).
Join thousands of other readers and subscribe to our blog.