A sophisticated DFA-focused advisor asked us to conduct some research on the following question:
Are there additional portfolio diversification benefits to combining concentrated portfolios of value and momentum stocks relative to combining less concentrated portfolios of value and momentum stocks?
In concrete terms, is combining a value fund with 300+ holdings (e.g., DFA Large Cap Value, DFLVX) with a momentum fund with 400+ holdings (e.g., AQR Momentum Fund, AMOMX), the optimal solution to capture the value and momentum expected risk premiums?
Or would we rather deploy capital into a value/momentum combination that consists of a 50 stock value fund and a 50 stock momentum fund?
I recruited Andrew Miller, CFA, CFP, a high-IQ, geeked-out advisor with Miller Financial, and we decided to put our heads together and tackle this question.
Concentrated or diluted? ‘Tis the question…
The concentrated version of value/momentum will earn higher expected returns, but with higher volatility; however, the concentrated combo may generate additional diversification benefits that offset the higher inherent volatility associated with the concentration. We find this to be the case.
First, some context to understand the question:
- Empirical fact #1: value stocks have earned higher returns than growth stocks
- Empirical fact #2: momentum stocks have earned higher returns than low momentum stocks
- Empirical fact #3: more concentrated value and momentum portfolios earn higher returns that diworsified value and momentum portfolios
- Empirical fact #4: combining value and momentum stock portfolios is more effective than doing either as a stand-alone
Now back to the question.
The question raised is interesting–but challenging–because one needs to distinguish among simultaneous effects. For example, comparing (1) a combination portfolio that consists of 50% in concentrated value portfolio and 50% in a concentrated momentum portfolio to (2) a combination portfolio that consists of 50% in non-concentrated value portfolio and 50% in a non-concentrated momentum portfolio to involves two elements:
- The extra return and risk associated with a more concentrated value or momentum portfolio; and
- The potential additional correlation benefits (i.e., a lower correlation would reduce portfolio risk)
In order to disentangle these effects and answer this question, we start with a brief review of some of the benefits and detriments associated with owning a concentrated versus a less concentrated portfolio of value and momentum stocks:
- A 50/50 portfolio invested in concentrated value and momentum stock portfolios.
- A 50/50 portfolio invested in non-concentrated value and momentum stocks.
Then we look at the rebalance bonus associated with each of these portfolio constructs.
Our test is an attempt to isolate the correlation benefit component of value/momentum combination portfolios, after controlling for the concentration benefit once we know and understand it.
Data Used
We use the Ken French stock portfolios formed according to Book to Market (B/M) for value stocks. Specifically, we use French’s top 30% of stocks, equally weighted, and sorted according to B/M as a proxy for a non-concentrated value portfolio and use French’s top 10% of stocks, equally weighted, and sorted according to B/M as a proxy for a concentrated value portfolio. We use Ken French’s 10 equal-weighted stock portfolios sorted according to 2_12 momentum to form the momentum portfolios. Specifically, we average deciles 8-10 as a proxy for non-concentrated momentum portfolios and use French’s highest decile as a proxy for a concentrated momentum portfolio (portfolios are equally weighted).
- Concentrated val/mom = Top 10%
- Non-concentrated val/mom = Top 30%
We examine the gross total returns (including dividends and cash distributions) and the sample period is 1927 to 2015.
Note: we conduct all the analysis with value-weight portfolios (not shown) and find similar results.
Review of Benefits & Detriments of Concentrated Portfolios
The primary benefit of concentrated value or momentum portfolios is that they have higher historical returns. Jack has a great post here about how momentum portfolios are influenced by concentration and rebalancing frequency (here is the same post on value). Additionally, Patrick O’Shaughnessy has a great post here showing similar results and arriving at a similar conclusion.
A quick note of clarification is perhaps in order: While rebalancing the individual stock holdings of a value or a momentum portfolio more frequently adds to returns, in expectation, there is another type of rebalancing that can occur: Rebalancing across allocations, or in our case value and momentum strategies. So for example, with a 50/50 allocation to value and momentum, we might rebalance the weights back to 50/50 every month.
Higher expected returns are a potential benefit of concentration, but is there a catch?
There are two potential detriments of owning a concentrated value or momentum portfolio: 1) volatility and 2) tracking error risk (volatility compared to a benchmark). These attributes make concentrated portfolios difficult to hold (often due to career risk considerations) and, arguably, is a factor that contributes to the sustainability of the premiums.
Rebalancing Benefits
We think rebalancing might be one of the most misunderstood concepts in investing. Michael Kitces does a nice job with a primer on rebalancing here. In the discussion of rebalancing that follows, we are referring to a rebalance of 2 or more asset classes back to some initial or target allocation.
The general principal is that as long as two assets have a similar long-term return, an increase in the standard deviation of the assets, or a decrease in correlation of the assets, can provide opportunities to increase returns through rebalancing. Although counter-intuitive, high volatility and low correlation are preferred to low volatility and high correlation assets, all else equal.
This concept of the so-called “rebalancing bonus” can be calculated using a formula that was popularized by William J. Bernstein here. The rebalancing bonus relies on a variety assumptions and is certainly not a silver bullet — and we recommend you read a variety of opinions on the subject
(1)— nonetheless, the rebalancing bonus concept is a useful way to answer the question we are trying to address in this short research piece.
We can use that formula to calculate the theoretical rebalancing “bonus” from the non-concentrated value and momentum portfolio and the concentrated value and momentum portfolio. First, we need some basic portfolio stats (standard deviation, correlation, etc.):
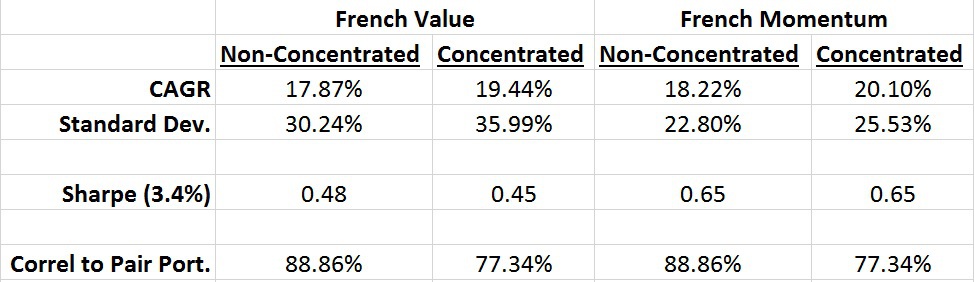
The statistics highlight that more concentrated val/mom portfolios earn higher compound annual returns and also have a lower correlation with each other. These more concentrated portfolios also have higher volatility, but this isn’t necessarily a bad thing if they lack correlation and one believes in the rebalance bonus can offset this effect.
Quantifying the Theoretical Value and Momentum Rebalance Bonus
Using the stats from above we can calculate the theoretical rebalancing bonus for both portfolios here:
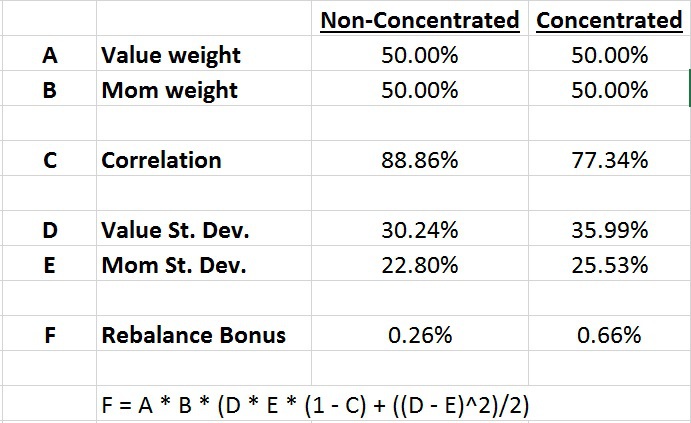
The theory shows that the combination of higher standard deviation and lower correlation between the concentrated value and momentum portfolio should lead to a return that is approximately 0.66% greater than the weighted average return of its parts. That is significant, and compares favorable with the expected 0.26% rebalancing bonus from the less concentrated value and momentum portfolios.
Can we generate even bigger rebalance bonus features?
The rebalance bonus associated with generic 10% val/mom cuts delivers an extra 66bps for concentrated value/momentum portfolios versus the 26bps associated with 30% diluted non-concentrated value/momentum portfolios. However, one could argue that our version of “diluted,” using the 30% signal cutoff, is still more active than many of the closet-indexing value and momentum offerings in the market, suggesting that there may be minimal rebalance bonus benefits from pooling the typical “smart-beta” products current in the market. On the flip side, the “concentrated” portfolio in our exercise (top 10% decile val/mom stocks), still contains over 100 stocks, on average — and this isn’t exactly “concentrated.” In theory, if we combine more concentrated value and momentum portfolios investors would earn an even higher expected rebalance bonus, than the 66bps identified in the exercise above.
To investigate the “does even more concentration help the rebalance bonus” hypothesis, we look no further than the Alpha Architect research and development lab.
We look at our Quantitative Value Index and our Quantitative Momentum Index from 1974 to 2015, where each portfolio consist of roughly 40-50 stocks at a given time. We crunched the numbers in the rebalancing bonus equation and find that the rebalancing bonus almost doubles to 1.24%! This is due to the fact that the correlation between the long-only custom indexes is .60 and the individual portfolio volatility is high (value = 18.5%, momentum = 25%).
(2)To summarize how the rebalance bonus works across the three concentration regimes of val/mom portfolios examined, we compile the results in the figure below:
- Diluted (Non-concentrated 30% cutoff, ~300 names per portfolio)
- Concentrated (concentrated 10% cutoff, ~100 names per portfolio)
- Really Concentrated (Quant Value and Quant Mom, which map out to roughly a ~5% cutoff, ~50 names per portfolio).
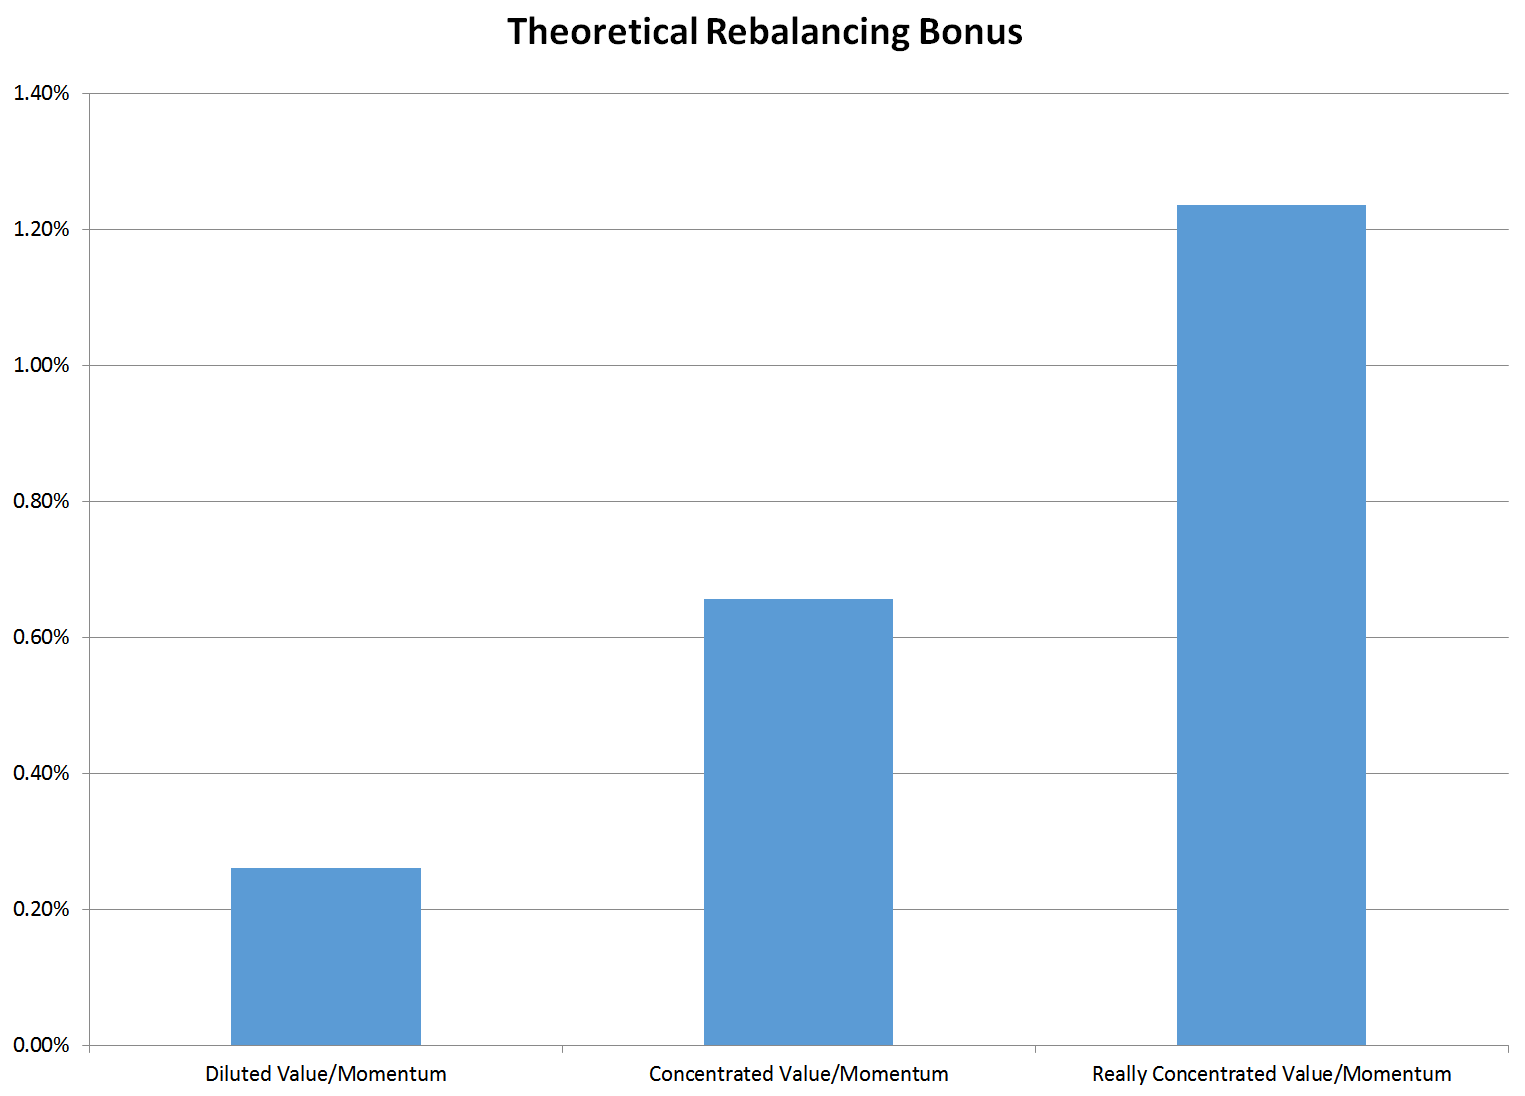
The results are clear: combining highly volatile, lower correlated value and momentum exposures, increases the rebalancing bonus.
Note. If we match the time periods — 1974 -2015 — for all series, the rebalance bonus is relatively much better for “really” concentrated. The diluted val/mom rebalance bonus is only 10bps and the concentrated val/mom is 26bps. The large drop in the rebalance bonus in recent times for generic val/mom is due to slightly higher correlations and much lower standard deviations.
Conclusion
Concentrated value and momentum portfolios have clear expected benefits (e.g., historically larger returns) and clear expected detriments (e.g., greater volatility). However, when these concentrated value and momentum portfolios are combined into one portfolio unit, it is possible to monetize the increased volatility (and lower correlation) in the form of a rebalancing bonus. Essentially turning a traditionally bad thing (i.e., idiosyncratic volatility) into a good thing (i.e., lower portfolio volatility).
Bottomline: Stop investing in “cheap” diluted closet indexing value and momentum exposures if you are trying to exploit value and momentum premiums. This is a sub-optimal approach. Instead, lean on modern portfolio theory mathematics, and invest in a portfolio that combines concentrated value and momentum exposures — you’ll give yourself a shot at earning a higher expected return and a much higher expected rebalance bonus. Win-win.
Note: This piece was co-written with Andrew Miller CFA, CFP

References[+]
| ↑1 |
editor sidenote: one can explore the rebalancing bonus in depth by reviewing he following links:
|
|---|---|
| ↑2 |
|
About the Author: Wesley Gray, PhD
—
Important Disclosures
For informational and educational purposes only and should not be construed as specific investment, accounting, legal, or tax advice. Certain information is deemed to be reliable, but its accuracy and completeness cannot be guaranteed. Third party information may become outdated or otherwise superseded without notice. Neither the Securities and Exchange Commission (SEC) nor any other federal or state agency has approved, determined the accuracy, or confirmed the adequacy of this article.
The views and opinions expressed herein are those of the author and do not necessarily reflect the views of Alpha Architect, its affiliates or its employees. Our full disclosures are available here. Definitions of common statistics used in our analysis are available here (towards the bottom).
Join thousands of other readers and subscribe to our blog.