A few years ago I wrote a summary on a working paper titled “A Lottery Demand-Based Explanation of the Beta Anomaly.” The paper is still a working paper, and has been updated (unfortunately they took out a neat picture from the original paper!). Here is a link to the new version of the paper, and the updated abstract is listed below.
The low (high) abnormal returns of stocks with high (low) beta — the beta anomaly — is one of the most persistent anomalies in empirical asset pricing research. This paper demonstrates that investors’ demand for lottery-like stocks is an important driver of the beta anomaly. When beta-sorted portfolios are constructed to be neutral to lottery demand, the beta anomaly is no longer detected. Regression analyses indicate a positive and significant relation between beta and expected stock returns after controlling for lottery demand. The abnormal returns associated with the beta anomaly are explained by a lottery demand factor. The beta anomaly exists only when the price impact of lottery demand falls disproportionately on high-beta stocks and is concentrated in stocks with low levels of institutional ownership.
An Introduction to Low Volatility Anomalies
The paper examines the low beta anomaly (an example of what is broadly deemed the “low volatility” anomaly), whereby low beta (volatility) stocks outperform high beta (volatility) stocks. According to asset-pricing theory, securities with higher risk should produce higher returns (two ways to measure risk are beta or volatility). Since low beta (volatility) stocks outperform high beta (volatility), this is labeled an anomaly. This paper attempts to give a plausible explanation for “why” such an anomaly should exist. Another plausible explanation, shown here, is that low beta stocks outperform due to leverage constrain/aversion. This paper highlights the fact that investor’s demand for lottery-type stocks can explain the low beta anomaly (using the MAX measure — simply the largest single-day return over the past year).
The paper is interesting, and I recommend those interested in low beta or low volatility type strategies go and read the current version of the working paper. Table 3 of the paper highlights what happens if one splits the universe (in the paper, all stocks above $5 share price) on two measures, beta and lottery-demand (MAX).
However, we decided to dig into the numbers and see what happens if we simply split a mid/large cap universe on two dimensions: beta and lottery-demand.
Universe and Experimental Design
We examine all U.S. stocks above the NYSE 40th percentile for market capitalization from 1/1/1963 – 12/31/2015 with the necessary data. This leads to a universe of mid/large cap stocks. The summary statistics on the universe are shown below (no fees or transaction costs are included):
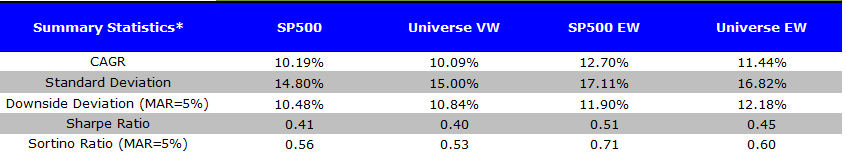
The results are hypothetical results and are NOT an indicator of future results and do NOT represent returns that any investor actually attained. Indexes are unmanaged, do not reflect management or trading fees, and one cannot invest directly in an index. Additional information regarding the construction of these results is available upon request.
The correlations on the VW Universe and the SP500 are 0.9921, while the correlation on the EW Universe and the Sp500 EW is 0.9718 — confirming that we are looking at similar universes.
Next, we sequentially split the universe of stocks on two dimensions:
- First, we take the universe and create 5 quintiles based on each firm’s beta measure. Beta is measured by regressing stock daily returns against the VW market over the past year. The quintiles based on Beta are formed every month (ie this is a monthly rebalanced strategy).
- Second, within each beta quintile, we create 5 quintiles based on the firm’s MAX measure, which proxies for lottery-demand. The MAX measure is simply the stock’s largest daily return over the past month.
As a result, we get 25 portfolios, formed monthly. The returns (CAGRs) to the portfolios are shown below from 1/1/1963 – 12/31/2015. No transaction costs or management fees are applied.
Value-Weight CAGRs (VW) across Volatility and Lottery Demand
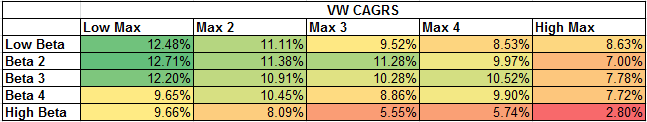
The results are hypothetical results and are NOT an indicator of future results and do NOT represent returns that any investor actually attained. Indexes are unmanaged, do not reflect management or trading fees, and one cannot invest directly in an index. Additional information regarding the construction of these results is available upon request.
Equal-Weight CAGRs (EW) across Volatility and Lottery Demand
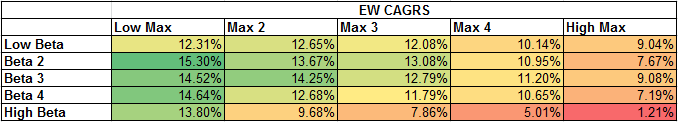
The results are hypothetical results and are NOT an indicator of future results and do NOT represent returns that any investor actually attained. Indexes are unmanaged, do not reflect management or trading fees, and one cannot invest directly in an index. Additional information regarding the construction of these results is available upon request.
A Few Takeaways for Low Beta and Low Volatility Strategies
- For every Beta quintile, in general, the highest MAX quintile (lottery-demand) has the worst returns. Part of this may be driven by short-term mean reversion, and part may be due to investor demand for lottery stocks (driving up the prices, and lowering future expected returns).
- A blanket statement that low beta stock outperforms high beta stocks may be too broad. While, on average, low beta stocks outperform, it is clear that a subset of high beta stocks perform just as well (or even better) than a subset of low beta stocks (especially when reviewing equal-weight portfolios, which are less prone to size effects).
While many investors/advisors have been attracted to low volatility strategies, we think it is important to understand the dynamics of these portfolios. The paper investigated — and our internal analysis — highlights an important fact that lottery-demand likely drives a lot of the results associated with low volatility strategies. Investors and advisors using low volatility strategies (or even building them from scratch) may want to take into consideration the results above and in the original paper.
Good luck.
A Lottery Demand-Based Explanation of the Beta Anomaly
Bali, Brown, Murray, and Tang
A version of the paper can be found here.
Want a summary of academic papers with alpha? Check out our Academic Research Recap Category.
Abstract:
The low (high) abnormal returns of stocks with high (low) beta — the beta anomaly — is one of the most persistent anomalies in empirical asset pricing research. This paper demonstrates that investors’ demand for lottery-like stocks is an important driver of the beta anomaly. When beta-sorted portfolios are constructed to be neutral to lottery demand, the beta anomaly is no longer detected. Regression analyses indicate a positive and significant relation between beta and expected stock returns after controlling for lottery demand. The abnormal returns associated with the beta anomaly are explained by a lottery demand factor. The beta anomaly exists only when the price impact of lottery demand falls disproportionately on high-beta stocks and is concentrated in stocks with low levels of institutional ownership.

About the Author: Jack Vogel, PhD
—
Important Disclosures
For informational and educational purposes only and should not be construed as specific investment, accounting, legal, or tax advice. Certain information is deemed to be reliable, but its accuracy and completeness cannot be guaranteed. Third party information may become outdated or otherwise superseded without notice. Neither the Securities and Exchange Commission (SEC) nor any other federal or state agency has approved, determined the accuracy, or confirmed the adequacy of this article.
The views and opinions expressed herein are those of the author and do not necessarily reflect the views of Alpha Architect, its affiliates or its employees. Our full disclosures are available here. Definitions of common statistics used in our analysis are available here (towards the bottom).
Join thousands of other readers and subscribe to our blog.