After reviewing the 2016 performance of trend-following (-18.15%), its unclear why anyone would mention the word “trend following” in a public forum. But we’ll give it a whirl anyway…
The comedian Victor Borge once famously observed, “Santa Claus has the right idea – visit people only once a year.”
In studying investment markets, many have taken a similar approach, preferring a once-a-year perspective, which has become a standard convention in academic research.
For example, in market anomaly research, academics often use data that employs an annual rebalance. This is true for many well-known anomalies based on fundamentals such as book-to-market based strategies. Researchers prefer annual data, since quarterly data can be subject to revision, whereas annual information (i.e., 10-k) tends to be a more stable and reliable. While the use of annual data is more robust from a data integrity standpoint, this approach also implies empirical observations will be based on “low frequency” information, since stock characteristics are measured only once every 12 months.
But in the real world, portfolio managers are not like Santa, who gets focused on his job only once a year. Practitioners often rebalance more frequently, since this can be more effective. For instance, Jack posted here about how more frequent rebalancing can enhance value portfolios, even after accounting for costs. Also, Asness and Frazzini have a paper on how more frequent updating of B/M enhances the performance of the B/M anomaly.(1) In “Anomalies Enhanced: The Value of Higher Frequency Information,” by Han, Huang and Zhou, the authors explore whether they can improve anomaly results by making use of higher frequency information.
What type of information?
Specifically, they wanted to see if they could use monthly price performance data to inform a more frequent, monthly rebalance, in which they would go long “good” stocks, and short “bad” stocks within the long/short legs of various anomalies.
The authors apply a simple trend performance rule to make use of high frequency (monthly) performance information. The strategy is quite straightforward, and is referred to as Moving Average Convergence/Divergence (MACD), as originally proposed by Gerald Appel in the late 1970s. Since it’s based only on prices it’s easy for average investors to apply.
Every month, the authors evaluate each stock in the anomalous portfolios:
- If the 50-day MA price is above than the 200-day MA price, keep it in the long leg of an anomaly as a “good” stock; otherwise, sell it;
- If the 50-day MA price is lower than the 200-day MA price, keep it in the short leg of an anomaly as a “bad” stock; otherwise, drop it.
Then they apply this simple trend-following methodology to the below eight anomalies. The sample period is from July 1965 to Dec 2013.
- Book-to-market ratio anomaly (BM) — Fama and French (1996, 2008)
- Operating profit anomaly (OP) — Fama and French (2015)
- Gross profitability anomaly (GP) — Novy-Marx (2013)
- Asset growth anomaly (AG) — Cooper, Gulen, and Schill (2008)
- Investment growth anomaly (IK) — Xing (2008)
- Net stock issue anomaly (NS) — Ritter (1991)
- Accrual anomaly (AC) — Sloan (1996)
- Net operating assets anomaly (NOA) — Hirshleifer, Hou, Teoh, and Zhang (2004)
The eight anomalous portfolios are constructed based on their accounting variables for the fiscal year ending in calendar year t-1. Next, the authors create equal weight decile portfolios, and spread portfolios between the high and low deciles. Anomaly portfolios are rebalanced annually, and stocks < $5 are deleted to eliminate microstructure issues.
The authors apply the above MA filter on each anomaly each month to keep only “good” stocks in the long leg of the anomaly, and only “bad” stocks in the short leg. In short, they keep stocks whose trends continue, but drop stocks whose trends reverse. Next they form equal-weight portfolios using the remaining stocks left in the deciles, and calculate spread portfolios.
This approach is differentiated from a strictly cross-sectional approach, in that it uses the time series properties of individual stocks as an overlay on a simple cross-sectional approach. The idea is that higher frequency information — in the form of short-term momentum signals — can add value to a static anomaly portfolio with an annual rebalance.
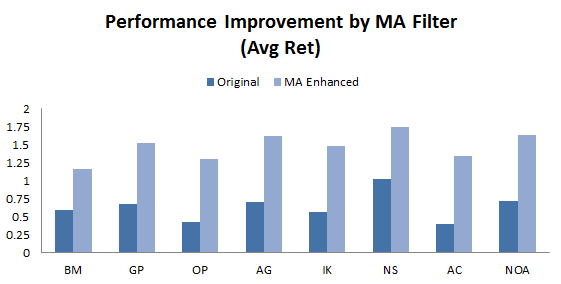
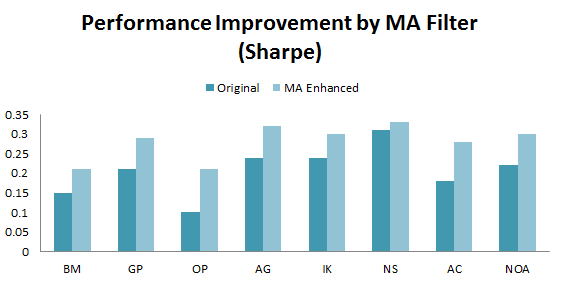
Performance Improvement by MA Filter
The results show that the performance of all the eight annual anomalies is greatly enhanced by the above simple MA approach. (Here is the visual depiction of the results in Table I in the paper)
The results are hypothetical results and are NOT an indicator of future results and do NOT represent returns that any investor actually attained. Indexes are unmanaged, do not reflect management or trading fees, and one cannot invest directly in an index. Additional information regarding the construction of these results is available upon request.
The results are hypothetical results and are NOT an indicator of future results and do NOT represent returns that any investor actually attained. Indexes are unmanaged, do not reflect management or trading fees, and one cannot invest directly in an index. Additional information regarding the construction of these results is available upon request.
Digging into the Results
Seem like a home run! As a result of using the MA filter, all the anomalies show statistically significant (at the 1% level) increases in returns for the spread portfolios, with incremental spread returns ranging from 0.57% to 0.94%.
What’s not to like about this strategy? Let’s dig a little deeper.
First, the authors want to know what this MA filter does when applied to all stocks, which will be the benchmark. They find the spread of the MA rule yields 0.50%. Now, compared with that benchmark, the incremental spread of 0.57% to 0.94% doesn’t look quite as impressive.
Second, the performance gains from using this “crossover MA” rule come mostly from the short side. When the authors examine the improvement in Fama-French 3-factor alpha using the MA filter, they find the alphas on the short side to be significantly negative and large, whereas on the long side, the alphas are small and insignificant. In addition, performance improvements in the short leg are much larger than those in the long leg. The MA rule seems to succeed because it drops stocks on the short side whose trends are reversing, suggesting an imminent rebound.
We are left with an MA strategy that mostly enhances the short side of the anomalies, whose spread performances are themselves dominated by the short leg to begin with. From a practitioner perspective, this implies a number of potential issues, since there are numerous impediments to using short sales to benefit from overpricing.
Information Uncertainty
While we may have some questions about the practical implementability of this strategy in the real world, the results are interesting from a theoretical perspective.
We’ve examined the world’s longest trend-following backtest and demonstrated that simple moving averages appear to be a robust risk-management signal over the past 200 years. Why might this particular flavor of trend following work so well in this context? The authors go on to conduct some additional tests that shed light on how and why this MA strategy seems to work.
The authors hypothesize it has to with “information uncertainty.” The authors measure this using three proxies: Idiosyncratic volatility (we have posted here on this previously), firm age and number of analysts.
The authors propose the following:
“Han, Yang and Zhou (2013) shows that the profitability of a simple moving average rule is critically dependent on information uncertainty of stocks. Stocks with high information uncertainty generate profits from the MA timing strategy.”
To confirm their hypothesis, the authors use three proxies to measure information uncertainty and compare the performance of firms with different levels of information uncertainty:
- Idiosyncratic volatility: The higher the idiosyncratic volatility, the higher the information uncertainty
- Firm age: The younger the firm, the higher the information uncertainty.
- Number of analysts following: Firms covered by fewer analyst tend to have more information uncertainty.
The results show that firms with higher information uncertainty (higher idiosyncratic volatility, younger age, covered by fewer analyst) benefit the most from the simple MA rule. The authors suggest that this may be because the annual characteristics used to form the anomaly portfolios are a less reliable signal for these firms, than for firms with lower information uncertainty.
But there could be more bad news: It may be that firms with higher information uncertainty are also more costly and difficult to short.
Note:For a related post on how to simply incorporate trend-following into a strategy to enhance the benefits of investing in factor-based anomalies, check out our post on creating an alternative investment strategy with value and momentum. One can arguably achieve a same end-state with this approach, but save a lot of brain damage.
Anomalies Enhanced: The Value of Higher Frequency Information
- Han, Huang and Zhou
- A version of the paper can be found here.
- Want a summary of academic papers with alpha? Check out our Academic Research Recap Category.
Abstract:
Many anomalies are based on low frequency attributes, such as annual characteristics, that ignore higher frequency information. In this paper, we provide a simple strategy to incorporate the higher frequency information. We find that there is significant economic value-added. For eight major anomalies, we find that the enhanced anomalies can double the average returns while having similar or lower risks. The results are robust to a number of controls.

 https://alphaarchitect.com/wp-content/uploads/2016/12/hml-devil.png 737w" sizes="(max-width: 500px) 100vw, 500px" />
About the Author: Wesley Gray, PhD
—
Important Disclosures
For informational and educational purposes only and should not be construed as specific investment, accounting, legal, or tax advice. Certain information is deemed to be reliable, but its accuracy and completeness cannot be guaranteed. Third party information may become outdated or otherwise superseded without notice. Neither the Securities and Exchange Commission (SEC) nor any other federal or state agency has approved, determined the accuracy, or confirmed the adequacy of this article.
The views and opinions expressed herein are those of the author and do not necessarily reflect the views of Alpha Architect, its affiliates or its employees. Our full disclosures are available here. Definitions of common statistics used in our analysis are available here (towards the bottom).
Join thousands of other readers and subscribe to our blog.