Tomorrow I’ll be sitting with Pat O’Shaughnessy and Ben Johnson to discuss “Straight Talk About Smart Beta.” Here is a link to the big Morningstar event.
In preparation for our discussion we were spitballing ideas and Ben brought up the concept of helping investors understand the similarity/differences between live “factor” funds and the academic factor portfolios often used for research purposes.
As we will see from the case study below, there seems to be no resemblance.
In theory, if live funds roughly reflect the construction of the portfolios used to identify “alpha” in the academic research, one would expect to roughly perform in line with these theoretical portfolios. Of course, if live factor funds show no reflection whatsoever of the academic portfolios studied, then investors should not expect to achieve similar results to those that have been studied in the past.
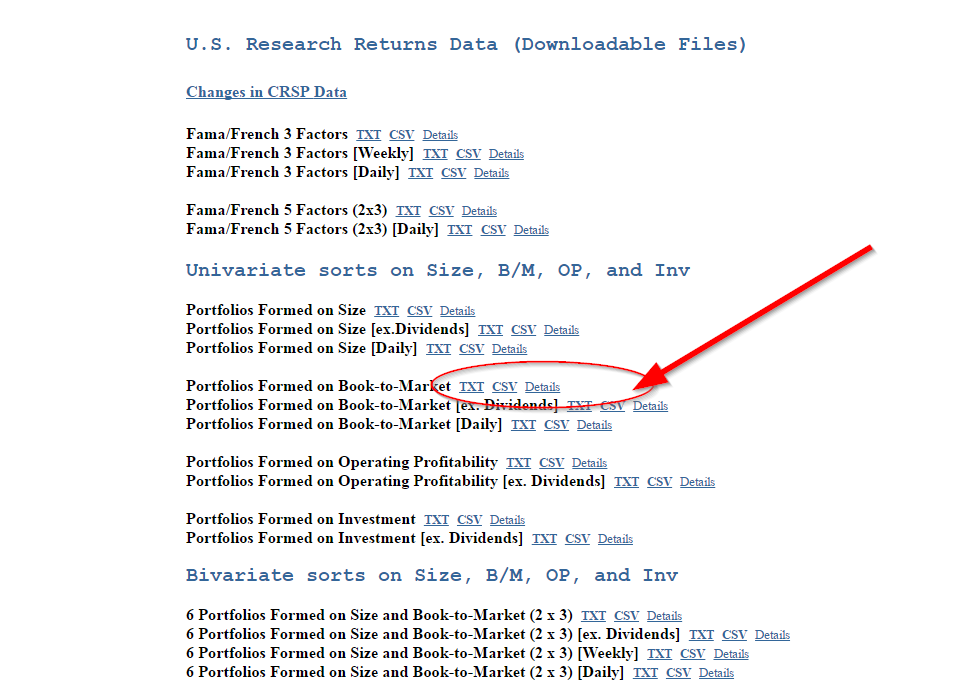
For example, consider the generic book-to-market factor. The simplest way to express this “academically” is to sort all stocks from high to low on B/M, buy the top 10%, annual rebalance. Rinse, repeat. In fact, one can download the returns and study these returns by simply downloading the return series from Ken French’s website: http://mba.tuck.dartmouth.edu/pages/faculty/ken.french/ftp/Portfolios_Formed_on_BE-ME_CSV.zip
If you run the stats on this portfolio relative to the passive index you’ll identify a long-term excess return of a few percent per annum. Doesn’t sound like much, but compound at 3% higher than the index over a 100 years and you start to seperate the millionaires from the billionaires. Of course, you’ll also identify that simple value portfolios are insanely volatile and go through long bouts of underperformance. Great, I understand the risk and reward. Sign me up, what’s the next step?
Let’s go buy a fund that does this strategy and capture this premium…right?
Uhh…not exactly…
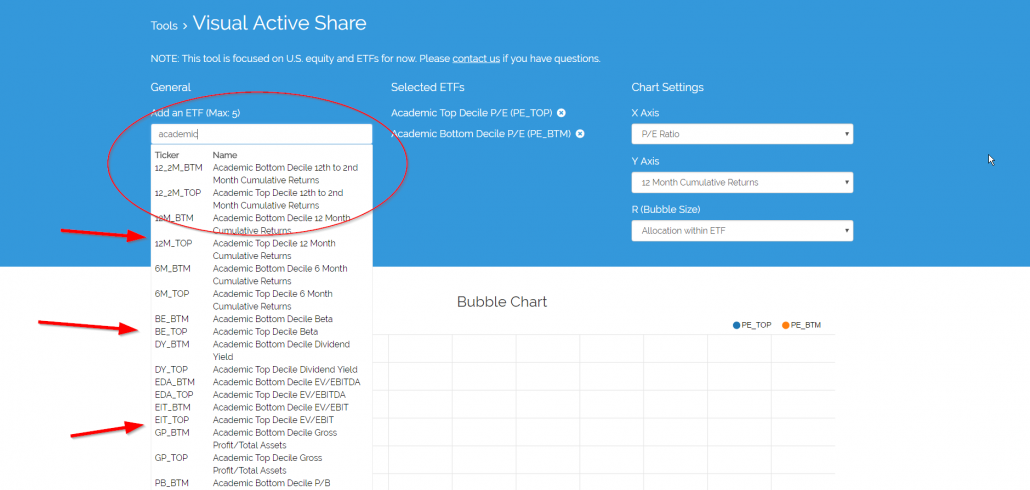
We recently loaded “academic” factors into our visual active share database so users can explore how various funds actually line up against theoretical academic portfolios.
For example, start typing “academic” in the “add an ETF” search bar. You’ll notice that we have constructed decile portfolios for every factor characteristic in our database.
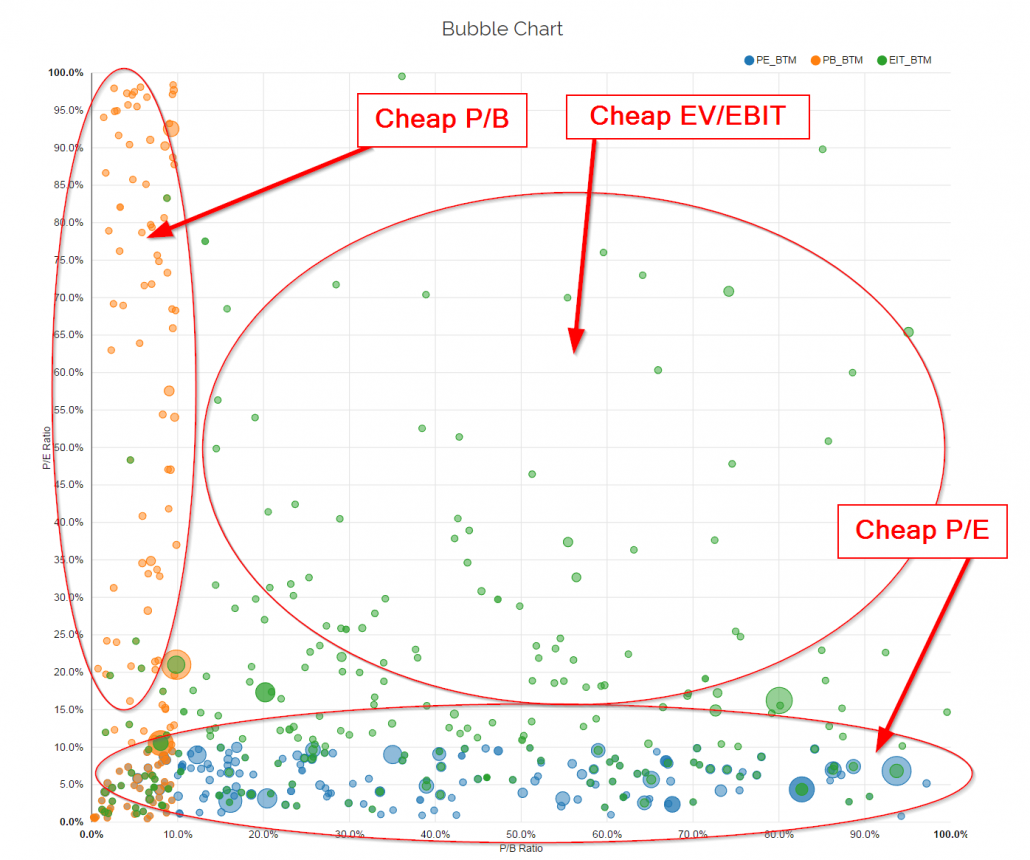
Let’s look at the cheapest stocks on P/E, P/B, and EV/EBIT:
Remarkably, there is currently not a ton of overlap between cheap P/B and cheap P/E. And mixed overlap for EV/EBIT and P/E and P/B. Or as Chris Meredith explains, “Factors aren’t commodities.”
Let’s now look at the iShares VLUE value “factor” fund to see if they are exploiting the academic value factor. This fund is often used by advisors to exploit the so-called value premium. And how could it not? The name and ticker are pretty clear that this is a “value factor” fund. Awesome. But let’s dig into the weeds a bit.
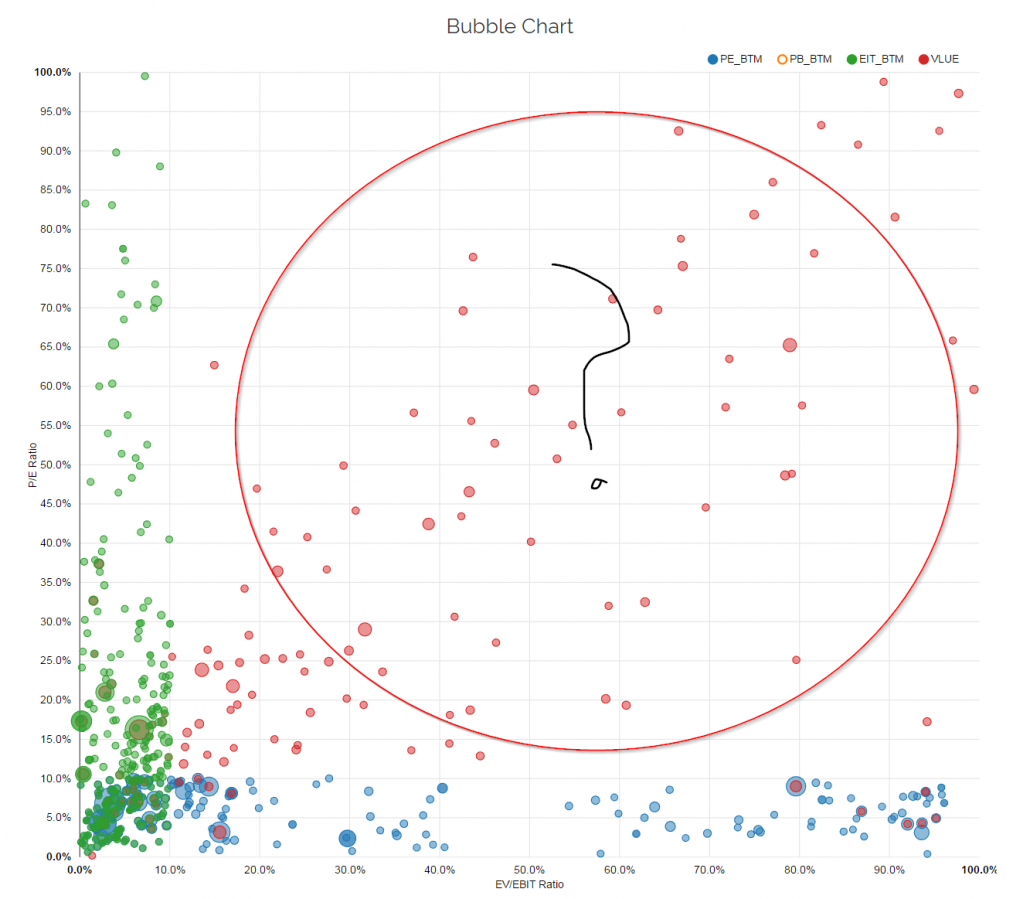
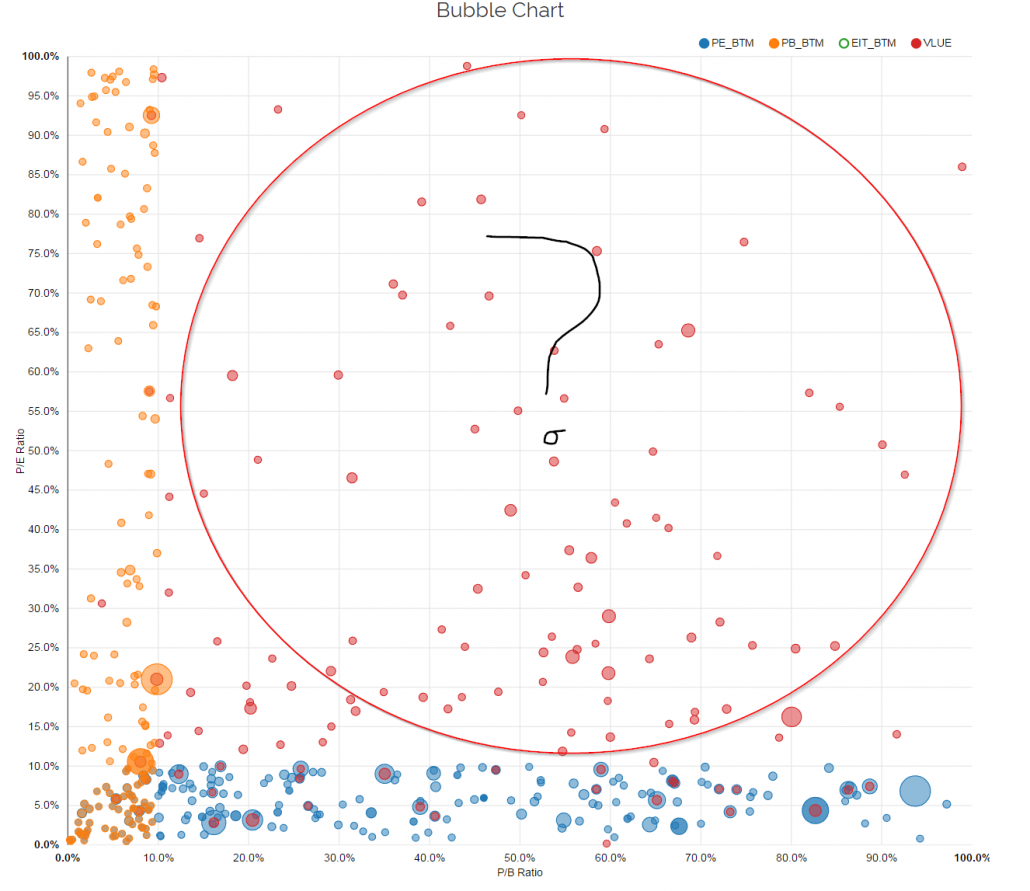
First, let’s look at the VLUE holdings along the P/E and P/B dimension:
VLUE clearly doesn’t exploit cheap P/E or EV/EBIT characteristics.
How about we look along the P/E and P/B dimensions? The index construction file suggest they weight P/B fairly heavily (see index methodology here)
Nope, still not much value for the value factor fund.
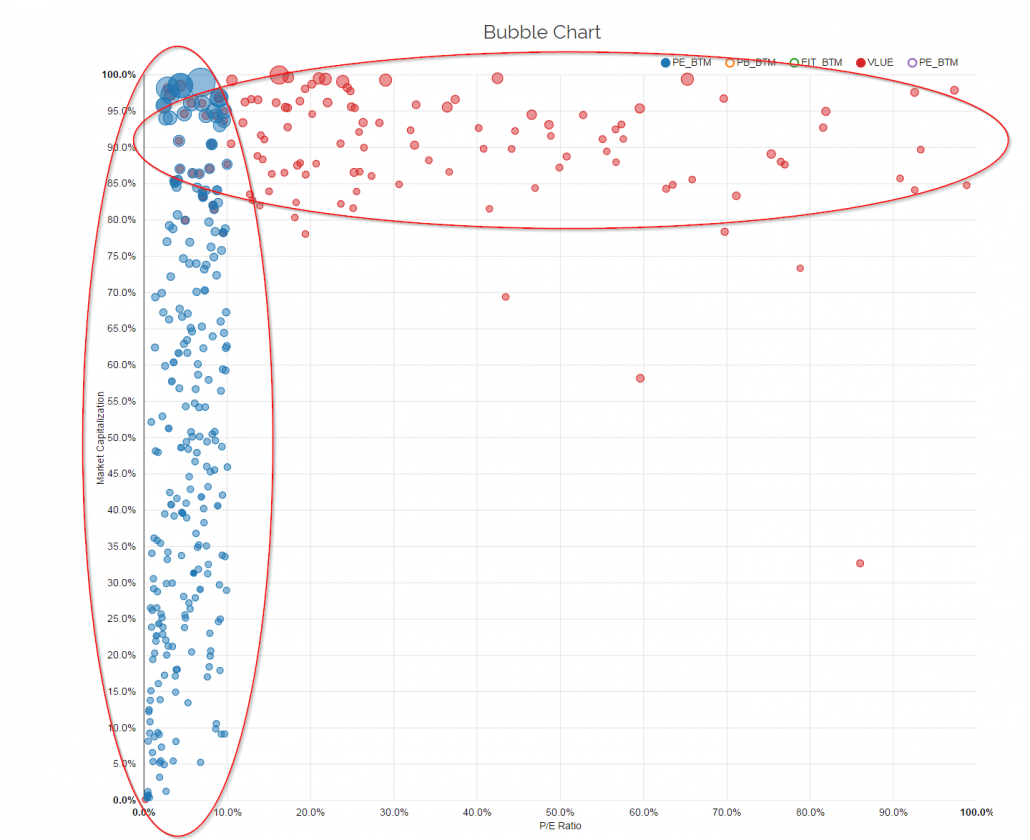
How about we look at VLUE but substitute market cap on one dimension?
Bingo. Now we can visually identify what VLUE is all about. VLUE is not a value fund at all, it is simply a large-cap stock factor fund. If one were to sort on the top 10% of the stock universe on size they would essentially replicate the VLUE fund.
Fascinating.
Good luck finding live factor funds that actually have any resemblance to the academic portfolios studied and examined in the academic literature. If you find any, let us know.
Moreover, this basic analysis begs a simple question: If investors believe in the evidence presented in academic research, why are they buying factor funds with no resemblance to the portfolios that generated the evidence in the first place?
Weird.
About the Author: Wesley Gray, PhD
—
Important Disclosures
For informational and educational purposes only and should not be construed as specific investment, accounting, legal, or tax advice. Certain information is deemed to be reliable, but its accuracy and completeness cannot be guaranteed. Third party information may become outdated or otherwise superseded without notice. Neither the Securities and Exchange Commission (SEC) nor any other federal or state agency has approved, determined the accuracy, or confirmed the adequacy of this article.
The views and opinions expressed herein are those of the author and do not necessarily reflect the views of Alpha Architect, its affiliates or its employees. Our full disclosures are available here. Definitions of common statistics used in our analysis are available here (towards the bottom).
Join thousands of other readers and subscribe to our blog.


