Over the past few years, we’ve been asked questions related to the relationship between stock prices and interest rates.
Forms of the question typically look like the following:
- If interest rates rise, what happens to stock prices?
- What is the relationship between stocks prices and bond yields?
All of these questions, in one form or another, are asking about the “Fed Model.” This model compares the inverse of the stock market’s P/E ratio (the E/P ratio, or “earnings yield”) to the current yield on 10-year Treasury Bonds.
On one hand, simply looking at the P/E ratio on the market may tell you all you need to know about future expected returns. However, on the other hand, perhaps the interaction between P/E and interest rates is more telling? If interest rates are low, then perhaps stock market P/Es can be high and investors can still achieve a high expected return.
To address these sort of questions, Cliff Asness has an old article titled, “Fight the Fed Model,” which suggests that analysis comparing P/Es to interest rates is simply wrong.
A Brief Introduction to “The Fed Model”
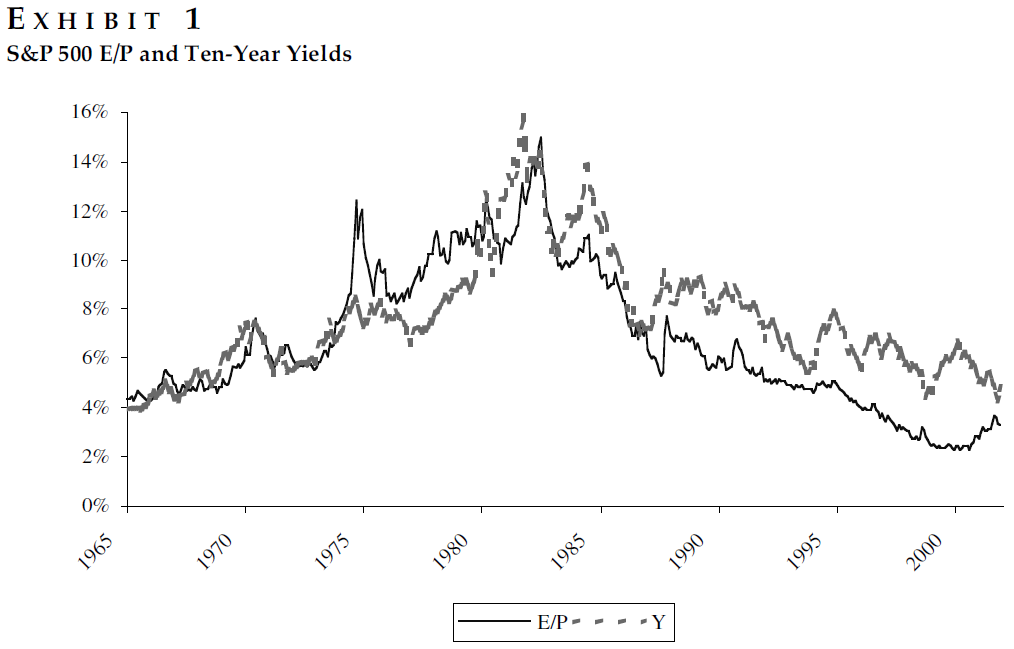
The Fed Model compares the earnings yield on stocks (E/P or the inverse of P/E) to the yield on a 10-year Treasury Bond. It is used among the financial crowd to generally state that stocks are “cheap” or “expensive” relative to an alternative investment–the U.S. 10-year Treasury Bond.
Exhibit 1 (below) graphs the earning’s yield (E/P) and the current 10-year Treasury Bond yield over time. As seen below, the two assets tend to move together.
The results are hypothetical results and are NOT an indicator of future results and do NOT represent returns that any investor actually attained. Indexes are unmanaged, do not reflect management or trading fees, and one cannot invest directly in an index. Additional information regarding the construction of these results is available upon request.
Cliff goes on to document 3 “intuitive” arguments for using the Fed model, and then highlights why they are wrong. Arguments 1 and 2 deal with the issue of comparing a nominal number (Y — the 10-year Treasury yield) to a real number (E/P — the earning’s yield). Argument 3 is an evidence-based argument, or as Asness puts it: “Just look at the Data.”
Here is the core rant from the paper:[ref]I highly recommend reading this part of the paper[\ref]
Pundits using this argument assume that because they show that P/Es are usually high (low) when inflation or interest rates are low (high), the Fed model is necessarily a reasonable tool for making investment decisions. This is not the case. If investors mistakenly set the market’s P/E as a function of inflation or nominal interest rates, then Exhibit 1 is just documenting this error, not justifying it. … The pundits often confuse the two very different tasks put to the Fed model. They often demonstrate (each with a particular favored graph or table) that P/Es and interest rates move together contemporaneously. They then jump to the conclusion that they have proven that these measure should move together, and investors are thus safe buying stocks at a very high market P/E when nominal interest rates are low.
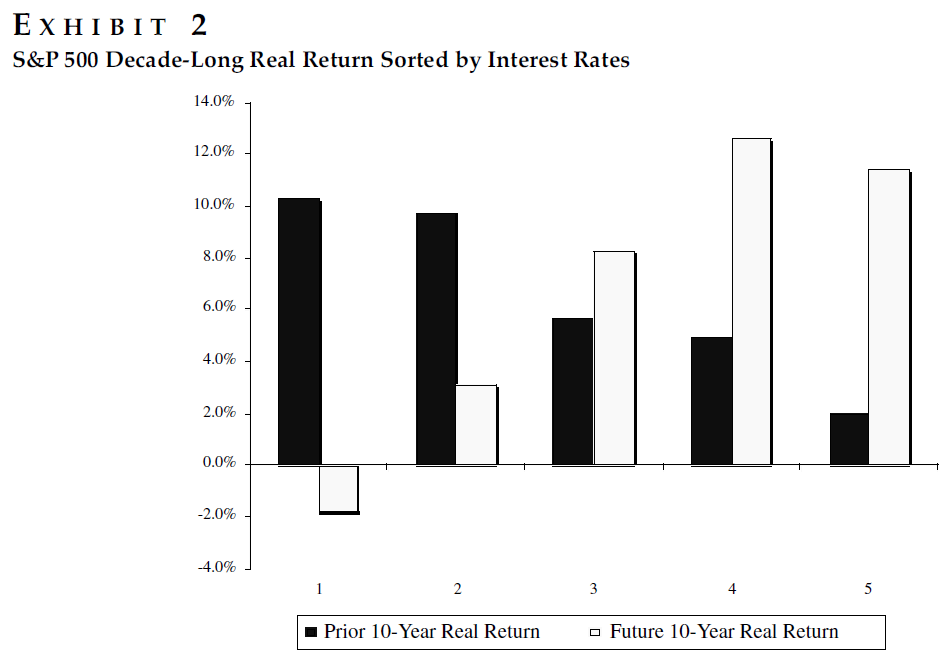
Exhibit 2 splits the universe into quintiles by examining the end-of-month 10-year Treasury yield for all months from 1965-2011. Within the quintiles, both the past and the future 10-year real stock returns for the SP500 are then examined. Quintile 1 (on the left) are the lowest 20% yielding months while Quintile 5 (on the right) show the highest 20% yielding months. Exhibit 2 (below), shows that when interest rates are low, this yielded the highest past real stock returns. In contrast, when interest rates are low, future real returns tend to be the lowest.
The results are hypothetical results and are NOT an indicator of future results and do NOT represent returns that any investor actually attained. Indexes are unmanaged, do not reflect management or trading fees, and one cannot invest directly in an index. Additional information regarding the construction of these results is available upon request.
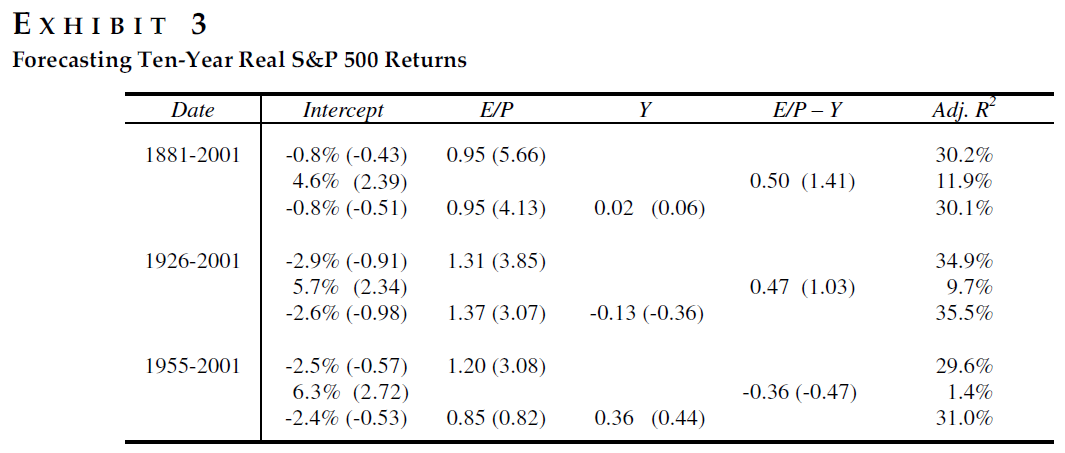
This image highlights the main argument of this paper–while the Fed model may be descriptive of current prices (see Exhibit 1), it says little about future expected real returns. This is further documented using regression analysis in Exhibit 3 (below). Exhibit 3 regresses the future 10-year real return of the SP500 against the current earning’s yield (E/P), 10-year Treasury rate (Y), and the Fed model (E/P – Y). The regression results highlight that the earning’s yield (inverse of the P/E ratio) is better at predicting future returns than the Fed model (E/P – Y), which is insignificant, as well as the current nominal interest rate (Y).
The results are hypothetical results and are NOT an indicator of future results and do NOT represent returns that any investor actually attained. Indexes are unmanaged, do not reflect management or trading fees, and one cannot invest directly in an index. Additional information regarding the construction of these results is available upon request.
Conclusion
This is a paper I highly recommend that everyone sits down and reads the entire text. The paper is easy to read and understand–I simply gave the big picture summary in this post. Main takeaway to remember–While the Fed Model can be good at describing how the market P/E is currently set, it is no better at predicting future stock returns than a model based on long-term P/E ratios.
As many now know, expected future returns are lower today than they were in the past, due to the P/E ratio being higher than in the past. However, using the Fed model as a justification to buy stocks is not good advice–the Fed model is descriptive, not predictive.
Finally, while P/E ratios are correlated with future returns, tactically leveraging this fact is exceedingly difficult. Here is an old post where we torture the data and finally get it to submit…a little.
Fight the Fed Model

About the Author: Jack Vogel, PhD
—
Important Disclosures
For informational and educational purposes only and should not be construed as specific investment, accounting, legal, or tax advice. Certain information is deemed to be reliable, but its accuracy and completeness cannot be guaranteed. Third party information may become outdated or otherwise superseded without notice. Neither the Securities and Exchange Commission (SEC) nor any other federal or state agency has approved, determined the accuracy, or confirmed the adequacy of this article.
The views and opinions expressed herein are those of the author and do not necessarily reflect the views of Alpha Architect, its affiliates or its employees. Our full disclosures are available here. Definitions of common statistics used in our analysis are available here (towards the bottom).
Join thousands of other readers and subscribe to our blog.