If you ask your typical long-only investor (or financial advisor) how momentum is doing this year they’ll likely say, “Amazing!”
This statement will almost surely be based on the fact they own (or know about) the iShares “Momentum Factor” Fund (Ticker: MTUM). MTUM is on fire year to date (through 5/31/2017):(1) 17.42% based on market prices versus 8.66% for the S&P 500 Total Return Index.
Not too shabby–Perhaps Eugene Fama and Ken French labeled momentum, “The premier anomaly,” for good reason!
But is MTUM a good representative of the momentum factor?
This is where the analysis gets confusing if one is trying to capture the classic academic momentum anomaly, which is associated with sorting the cumulative return over the past year, skipping the most recent month. Long story short, MTUM’s short-run performance doesn’t resemble anything that looks like momentum to an academic researcher.
First, the academic long/short momentum factor, as per Ken French’s website data, is down 1.70% through 5/31/17 (attempts to control for size effects).
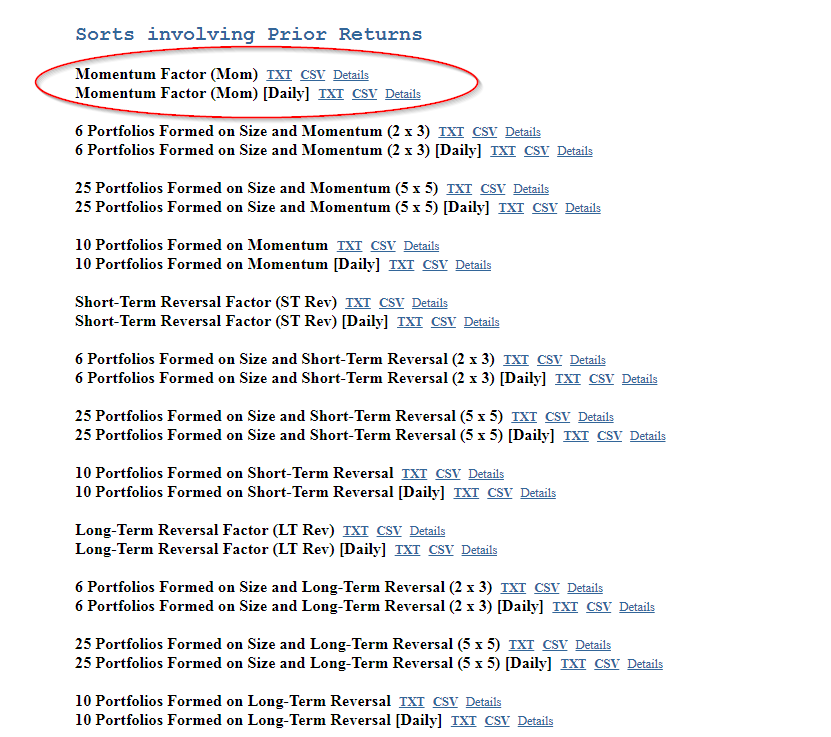
Where to get the data for long-only momentum factor long/short portfolios
So from a professional academic researcher prospective, momentum is actually sucking wind this year.
But MTUM is long-only and long/short factors can be confusing. Also, the vast majority of investors don’t invest in long/short factors, they invest in long-only factor portfolios. Let’s make this analysis simpler and focus on long-only momentum portfolios. We can refer back to Ken French’s data website and examine the YTD performance of long-only academic momentum decile portfolios, or portfolios of stocks sorted on the classic “2-12” price momentum measure.
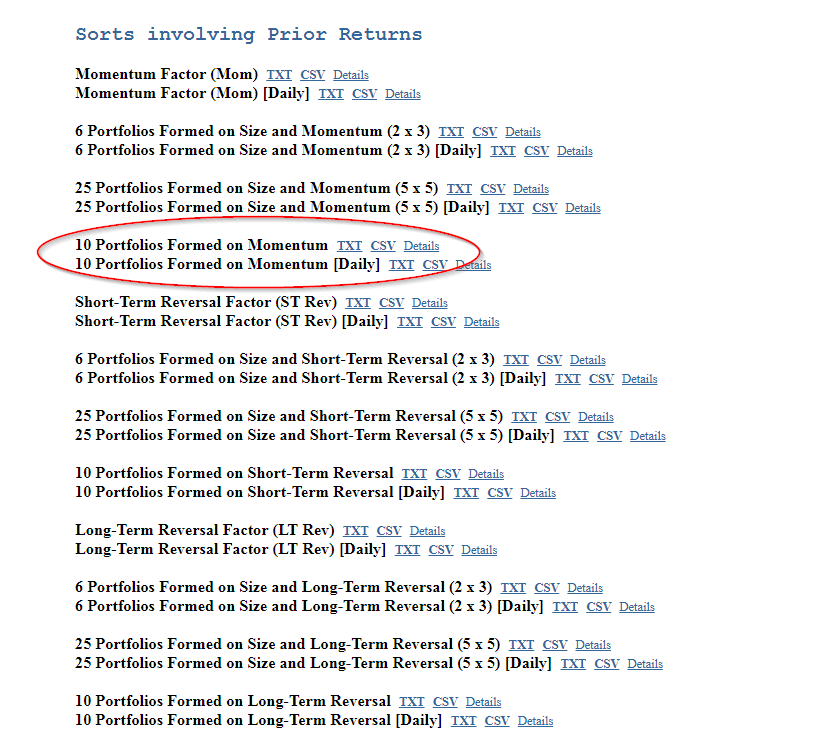
Where to get the data for long-only momentum decile portfolios
For the year, the market-cap weighted (or “value-weighted”) top decile momentum portfolio (“FF_MOM_VW”) is up 7.52% through 5/31/17, and the equal-weight top decile momentum portfolio (“FF_MOM_EW”) is up 0.49% through 5/31/17. The S&P 500 TR Index over the same period is up 8.66% while the S&P 500 EW TR Index is up 6.77%.
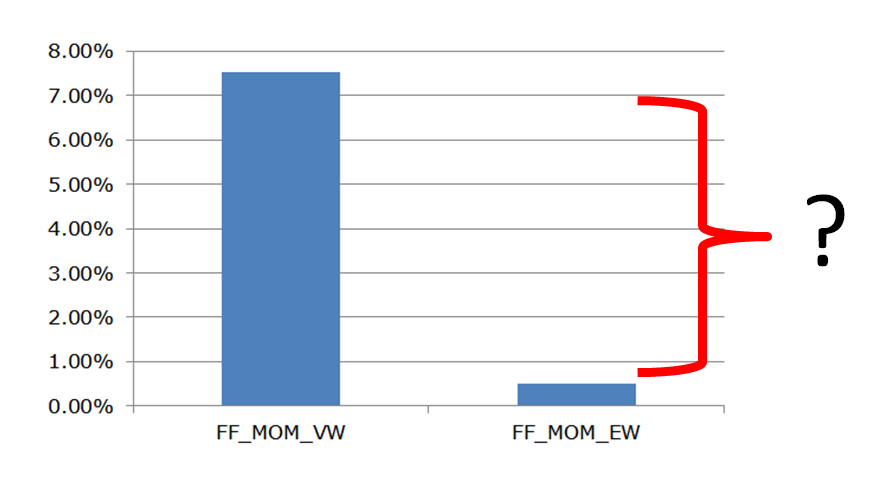
CAGR from 1/1/2017 to 5/31/2017. Data source: Ken French website The results are hypothetical results and are NOT an indicator of future results and do NOT represent returns that any investor actually attained. Indexes are unmanaged, do not reflect management or trading fees, and one cannot invest directly in an index. Additional information regarding the construction of these results is available upon request.
From the perspective of an academic researcher, not only did long/short momentum stink it up, but long-only momentum portfolios also sucked wind (relative to the SP500 and SP500 EW).
The large spread between VW and EW momentum results suggests there is strong “size” component to momentum returns. This explains in large part why MTUM has done so well this year, but certainly doesn’t explain all of it. Perhaps there is some magic secret sauce in the methodology of MTUM? Possible.
But one thing is clear: the bulk of the returns MTUM is capturing are probably unrelated to the academic momentum factor that has historically generated all the “buzz.”
Can We Visualize the Exposure to Size and Momentum?
MTUM doesn’t use the 2-12 momentum measure exclusively, but a mix of metrics developed by MSCI. They look at both a 2-6 month momentum and the 2-12 momentum, but scale these measures by volatility, and rebalance them every 6 months.(2) In the end, the index is theoretically built to capture the so-called momentum factor. However, the portfolio construction methodology suggests this fund is more of a mega-cap, low-beta-ish, quasi-momentum fund. To fact check what the fund construct is actually achieving from a factor characteristics standpoint, we can leverage our visual active share tool:
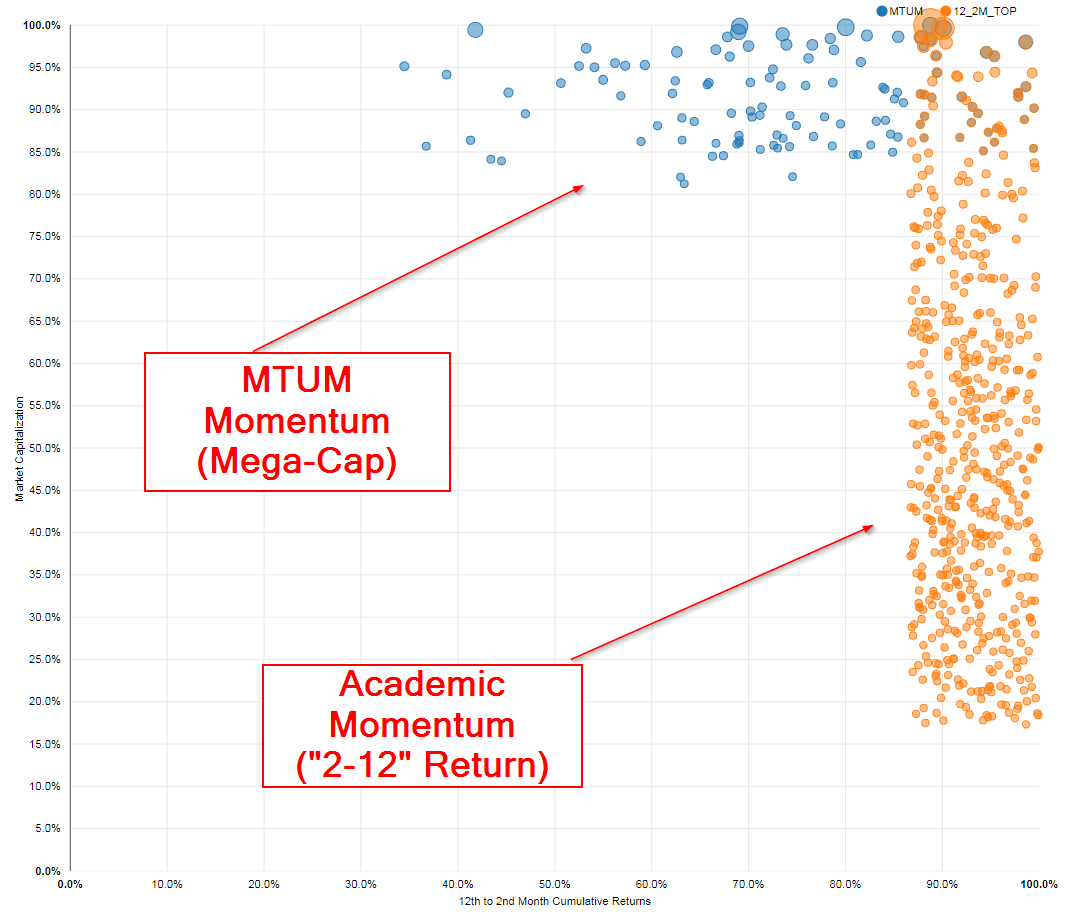
Source: Visual active share
The dots reflect individual holdings in the MTUM fund and what we label the “academic momentum” fund, which is a hypothetical construct that reflects a fund that holds the top decile of 2-12 momentum stocks, minus small-caps (bottom 20% based on market cap). (3)
The Y-axis is the percentile rank of holdings based on market cap. The X-axis is the percentile rank of holdings based on 2-12 momentum — the classic academic momentum measure, which most academic research is based upon.(4)
MTUM almost exclusively hold stocks that are in the top 80 percentile of the universe (most of the weight is in the stocks in the 90 percentile plus zone). In other words, the mega of the mega-caps only. This is especially true since the position weights are approximately market-cap weighted,(5) so the mega of the mega-caps get the highest weights. From a momentum perspective, the fund tends to hold stocks that are in the 40-100 percentile range based on the classic momentum characteristic. So there is certainly an element of momentum involved, but it is arguably a weak exposure. The characteristics visualization suggests the fund’s performance will likely be driven by exposure to mega-caps and beta, and perhaps a little bit of momentum.
A Breakdown on Generica Size/Momentum portfolios YTD
We now look at 25 portfolios independently sorted on size (i.e., market-cap) and momentum (2-12 momentum). Here is a detailed explanation from Ken French:
The portfolios, which are constructed monthly, are the intersections of 5 portfolios formed on size (market equity, ME) and 5 portfolios formed on prior (2-12) return. The monthly size breakpoints are the NYSE market equity quintiles. The monthly prior (2-12) return breakpoints are NYSE quintiles.
Interested readers can replicate this analysis by accessing the data via the link illustrated below:
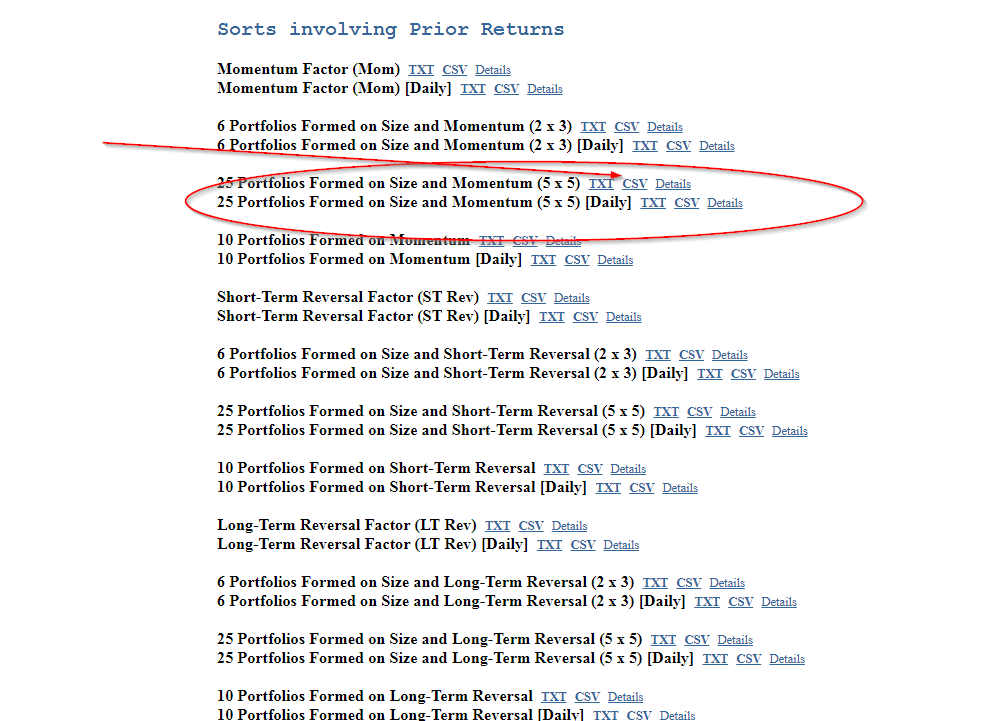
Where to get the data for long-only momentum/size portfolios
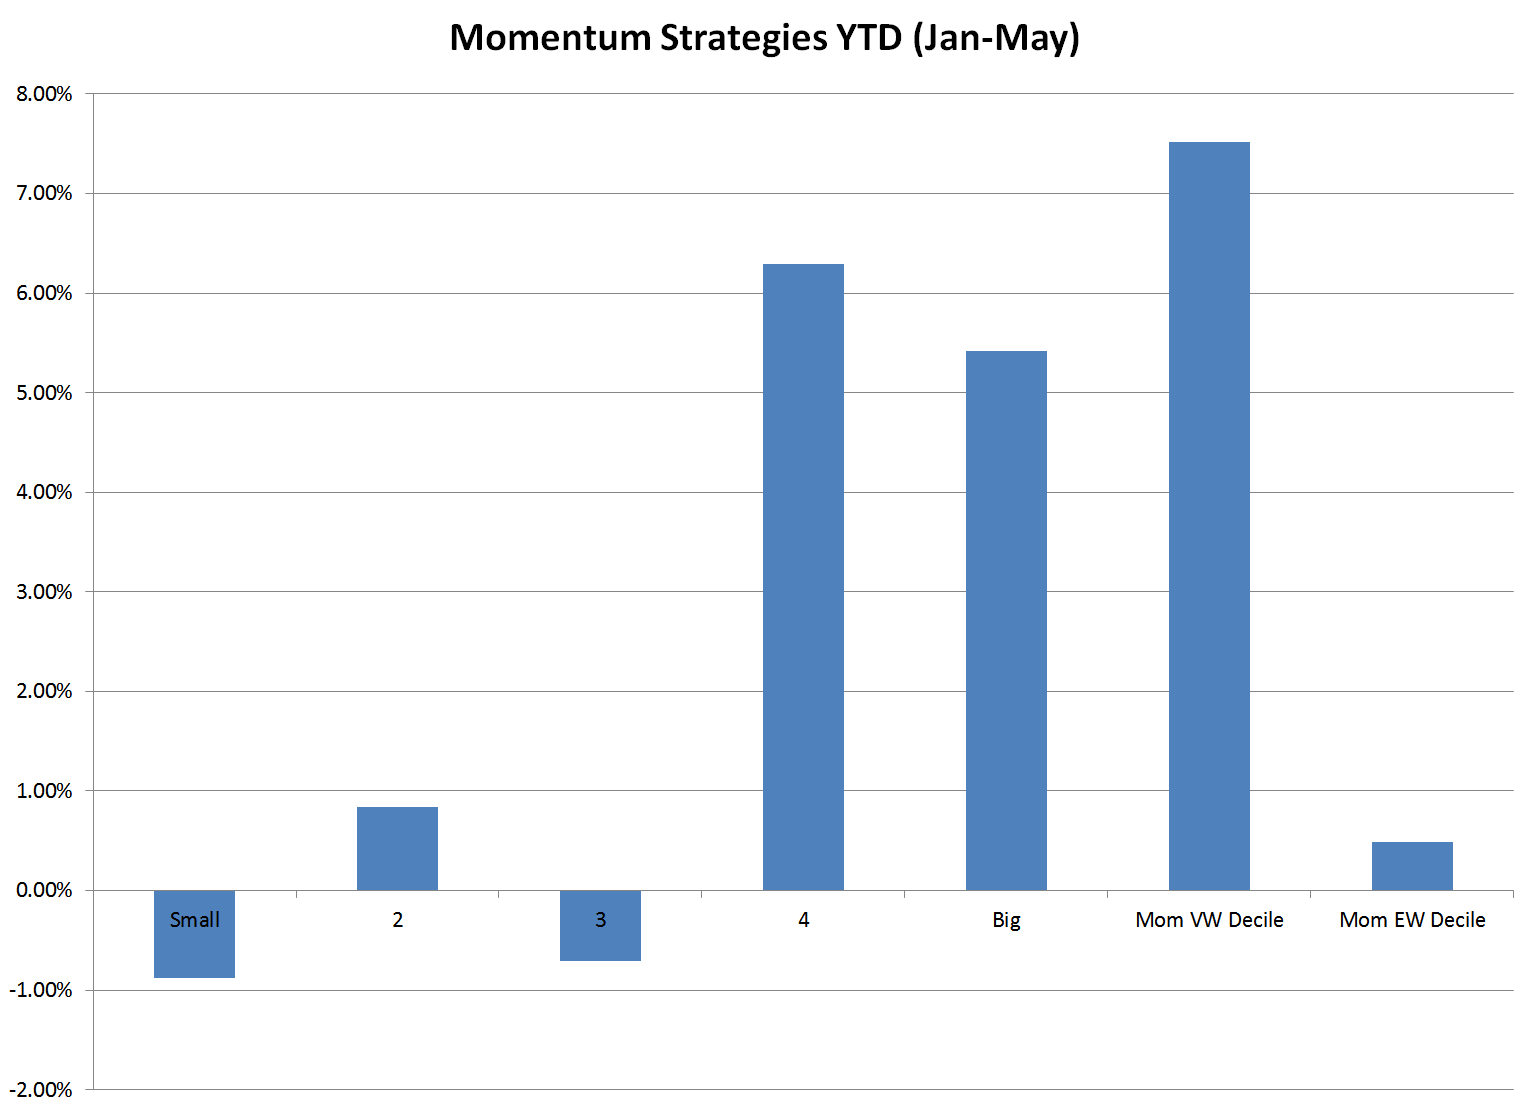
These 25 size/momentum sorted portfolios (5×5) allow us to look at the performance of the “academic momentum factor” across size quintiles– to be clear, we are taking the top quintile of momentum firms for each size quintile, and plotting the performance from 1/1/17 – 5/31/17 in the graph below (gross of any fees on the Ken French paper portfolios). We also add the performance of the top decile momentum portfolio, both value-weighted and equal-weighted (again gross of any fees).
The results are hypothetical results and are NOT an indicator of future results and do NOT represent returns that any investor actually attained. Indexes are unmanaged, do not reflect management or trading fees, and one cannot invest directly in an index. Additional information regarding the construction of these results is available upon request.
There is a clear size element associated with momentum returns YTD. Historically, momentum has worked better in smaller stocks (the effect isn’t as strong as it is with the value factor, but it’s there). Perhaps the factor world has turned upside down? Who knows…we’ll have to wait for a lot more out of sample data!
References[+]
| ↑1 | We go until 5/31/17 (and not 6/30/17) as this is the date of the most recent Ken French website data |
|---|---|
| ↑2 | There is an ad-hoc rebalance component as well. And as we know, a 6-month rebalance with momentum is a questionable approach. |
| ↑3 | We look at the same chart using 6 month momentum and come to similar conclusions |
| ↑4 | See here for a quick review of momentum measures |
| ↑5 | The official index methodology states they are momentum/market-cap weighted |
About the Author: Wesley Gray, PhD
—
Important Disclosures
For informational and educational purposes only and should not be construed as specific investment, accounting, legal, or tax advice. Certain information is deemed to be reliable, but its accuracy and completeness cannot be guaranteed. Third party information may become outdated or otherwise superseded without notice. Neither the Securities and Exchange Commission (SEC) nor any other federal or state agency has approved, determined the accuracy, or confirmed the adequacy of this article.
The views and opinions expressed herein are those of the author and do not necessarily reflect the views of Alpha Architect, its affiliates or its employees. Our full disclosures are available here. Definitions of common statistics used in our analysis are available here (towards the bottom).
Join thousands of other readers and subscribe to our blog.

