Social Screens and Systematic Boycott Risk
- H. Arthur Luo and Ronald J. Balvers
- Journal of Financial and Quantitative Analysis
- A version of this paper can be found here
- Want to read our summaries of academic finance papers? Check out our Academic Research Insight category.
What are the research questions?
In this study, a two-factor risk model is developed assuming differing preferences for “sin” or “no-sin” stocks for two groups of investors. Social screens are built into the model by assuming a small percentage of investors are self-restricting, declining to invest in “sin” stocks. Since each group of investors is facing a different set of investment opportunities, the derivation of a risk model comprised of a linear combination of the Market and a “Boycott risk factor” is possible.
The two-factor model predicts a close association of excess returns from “sin” stocks and the Boycott factor and provides a context for testing alternative explanations. A number of explanations of the excess return attributed to “sin” stocks include heightened “headline” risks and litigation risks; reduced investor base including institutional interest, all resulting in reduced liquidity and relatively more neglect from analysts and media. Researchers have suggested that these additional risks are undiversifiable and firm-specific, therefore requiring higher returns.
- Is the return to the Boycott risk factor positive?
- Is the intercept estimated from the Boycott-augmented CAPM model a nonsignificant value, as expected?
- Can the boycott risk premium be accounted for by alternative explanations including:
- Industry concentration or industry momentum
- Legal risk
- Illiquidity
- Neglect or analyst coverage
What are the Academic Insights?
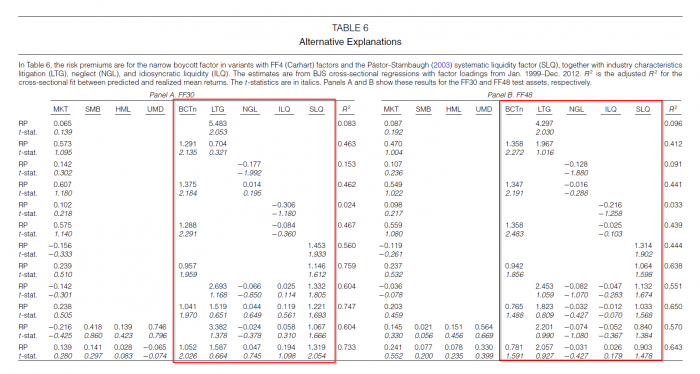
1. YES. At least six risk models were tested including the CAPM with and without the Boycott factor. The estimated monthly return to the Boycott risk factor ranged from 1.05% to 1.33% depending on the specification of the risk model. The factor return was significant, at 5%, for all specifications, a result similar in magnitude to that found in other studies. When the Boycott factor was included R2 increased from 10% t0 50%.
2. YES. When returns are adjusted for Market AND Boycott risk the abnormal return should decline to approximately to zero. Across the models tested, the estimate of the intercept ranged from -.15% to – .29% and was not significant.
3. Under all tests of sensitivity to alternative explanations, the Boycott risk premium maintains its significance and economic importance.
a. SOMEWHAT. Adding a measure of industry concentrations, the Herfindahl Index has no impact on the Boycott risk premium. However, the Carhart momentum variable reduces the Boycott premium by approximately 25%, but it remains significant.
b. NO. Using the Jagannathan and Wang (1998) measure, litigation risk is ruled out as an explanatory factor for Boycott risk premium.
c. SOMEWHAT. The sensitivity to liquidity issues associated with a reduced investor base, does trim the Boycott premium to some degree. However, when either of the variables are added to the cross-sectional regression, the coefficients on each are reduced. Even though liquidity risk is relevant it does not diminish the economic importance of Boycott risk.
d. NO. The measure of analyst coverage does not account for the Boycott premium.
Why does it matter?
The results of this study establish the Boycott aspects of sin stocks as a legitimate systematic risk factor. The risk premium derived in this study is theoretically coherent and empirically positive and significant. The evidence supports the notion that the outperformance of sin stocks noted in previous studies is indeed explained by their correlation with the Boycott factor. Robustness tests of alternative theories did not diminish the economic importance of the main result. Apparently, non-monetary aspects of firm activities have a significant impact on asset pricing.
What is the most important chart from the paper?
The results are hypothetical results and are NOT an indicator of future results and do NOT represent returns that any investor actually attained. Indexes are unmanaged and do not reflect management or trading fees, and one cannot invest directly in an index.
Abstract
We model the pricing implications of screens adopted by socially responsible investors. The model reproduces the empirically observed abnormal return to sin stock and implies a premium for systematic investor boycott risk that affects targeted as well as nontargeted firms. The investor boycott premium is not displaced by litigation risk, measures of neglect effect, illiquidity, industry momentum, or concentration. The investor boycott risk factor is useful in explaining mean returns across industries, and its premium varies with the relative wealth of socially responsible investors and the business cycle.

About the Author: Tommi Johnsen, PhD
—
Important Disclosures
For informational and educational purposes only and should not be construed as specific investment, accounting, legal, or tax advice. Certain information is deemed to be reliable, but its accuracy and completeness cannot be guaranteed. Third party information may become outdated or otherwise superseded without notice. Neither the Securities and Exchange Commission (SEC) nor any other federal or state agency has approved, determined the accuracy, or confirmed the adequacy of this article.
The views and opinions expressed herein are those of the author and do not necessarily reflect the views of Alpha Architect, its affiliates or its employees. Our full disclosures are available here. Definitions of common statistics used in our analysis are available here (towards the bottom).
Join thousands of other readers and subscribe to our blog.