On most mainstream finance websites, a good chunk of the stories discuss the FED and where interest rates are going. Intuitively, this makes sense: The FED is arguably an extremely influential component of U.S. economy.
But how do markets respond to the FED? Is the response rational, irrational, or something in between?
This is a good question, and one discussed in a working paper which we examine below. The paper is titled, “Monetary Momentum,” and is written by Andreas Neuhriel and Michael Weber. A version of the paper can be found here.
The paper additionally examines the returns to factor portfolios, as well as international markets.
Let’s dig into the paper.
Market Response to the FED
The paper begins by examining the returns to the market during either (1) expansionary policy or (2) contractionary policy. The sample goes from 1994 – 2009. The explanation for the dates chosen is given in the paper:
Our baseline sample runs from 1994, the first time when the FOMC started issuing press releases after meetings and policy decisions, until 2009, the start of the binding zero-lower bound (ZLB) period.
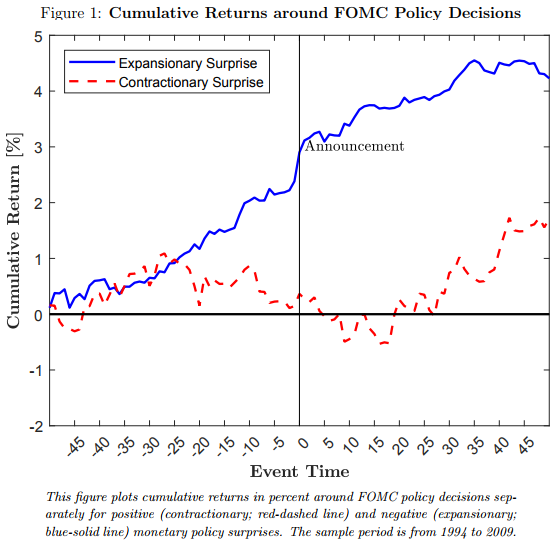
To identify an (1) expansionary policy or (2) contractionary policy, the authors use shocks to Fed Funds futures. This takes into account the market view of future rates.(1) Figure 1 of the paper (shown below) documents the returns to the U.S. market (CRSP VW Index) around FOMC decisions. As can be seen in the image, there is an upwards drift both before and after an expansionary surprise. Contractionary surprises have muted effects, both before and after the decision.
The results are hypothetical results and are NOT an indicator of future results and do NOT represent returns that any investor actually attained. Indexes are unmanaged, do not reflect management or trading fees, and one cannot invest directly in an index. Additional information regarding the construction of these results is available upon request.
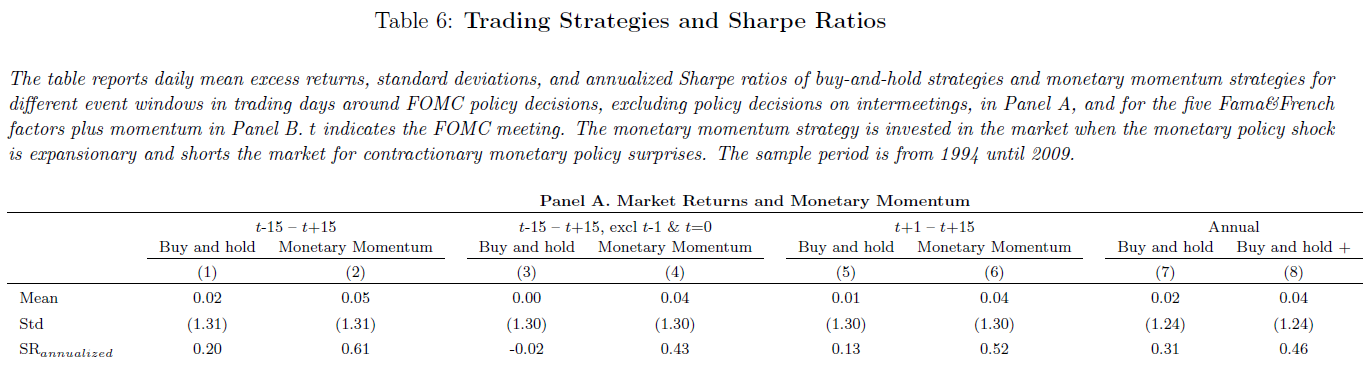
Table 6 (shown below) of the paper highlights a monetary momentum trading strategy, which is long the market when there are expansionary surprises, and short the market when there are contractionary surprises. Columns 1-4 show the returns from 15 days before to 15 days after the decision; however, this is not tradable as the returns start 15 days before the decision. Columns 5 and 6 represent a tradeable strategy, whereby one invests (either long or short) the day after the decision–this takes advantage of the drift after the decision shown in Figure 1 above. As can be seen, compared to B&H, the monetary momentum strategy has a higher Sharpe ratio.
The results are hypothetical results and are NOT an indicator of future results and do NOT represent returns that any investor actually attained. Indexes are unmanaged, do not reflect management or trading fees, and one cannot invest directly in an index. Additional information regarding the construction of these results is available upon request.
FOMC decisions and Factor Investing
As shown above, the FOMC decisions appear to have a big impact on market moves. But how do these decisions affect factor investing?
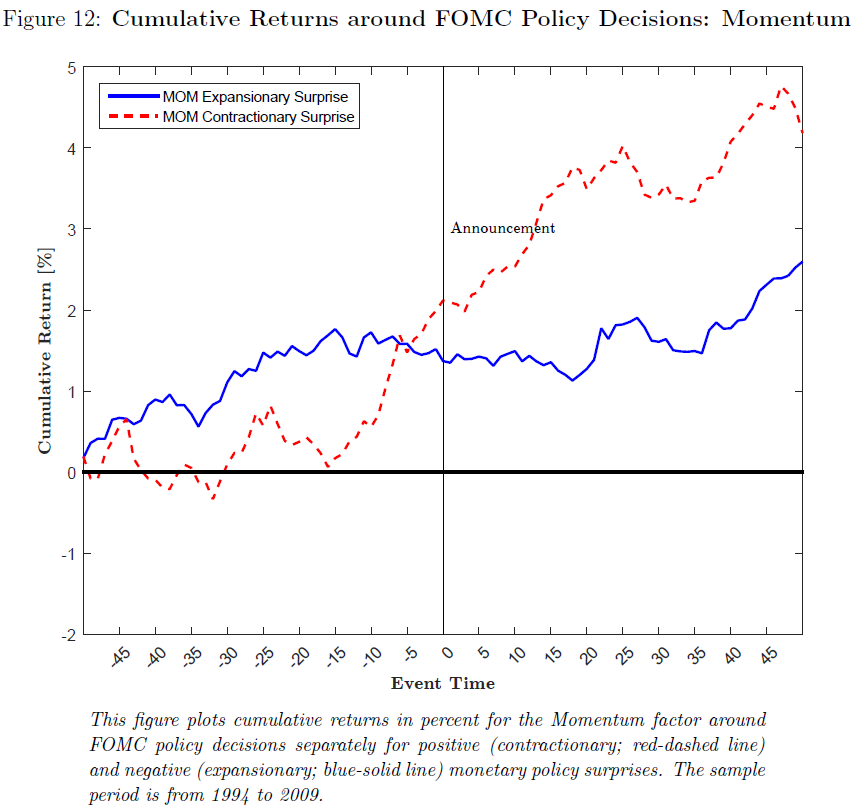
Figures 8-12 of the paper highlight the returns to the following factors: SMB, HML, RMW, CMA, and MOM. The SMB factor is impacted little by FOMC decisions. Expansionary policies have little effect on the other factors (HML, RMW, CMA, and MOM) as the long and the short tend to go up at the same time. However, contractionary policies appear to have an effect on these factors, as described in the paper:
Before contractionary monetary policy surprises, we see an upward drift of value firms relative to growth firms, high-profitability relative to low-profitability firms, and low- relative to high-investment firms, but the drift levels off at the announcement and is smaller than the drift for the overall market.
For momentum, there is a large effect during contractionary decisions, as shown in Figure 12 below:
The results are hypothetical results and are NOT an indicator of future results and do NOT represent returns that any investor actually attained. Indexes are unmanaged, do not reflect management or trading fees, and one cannot invest directly in an index. Additional information regarding the construction of these results is available upon request.
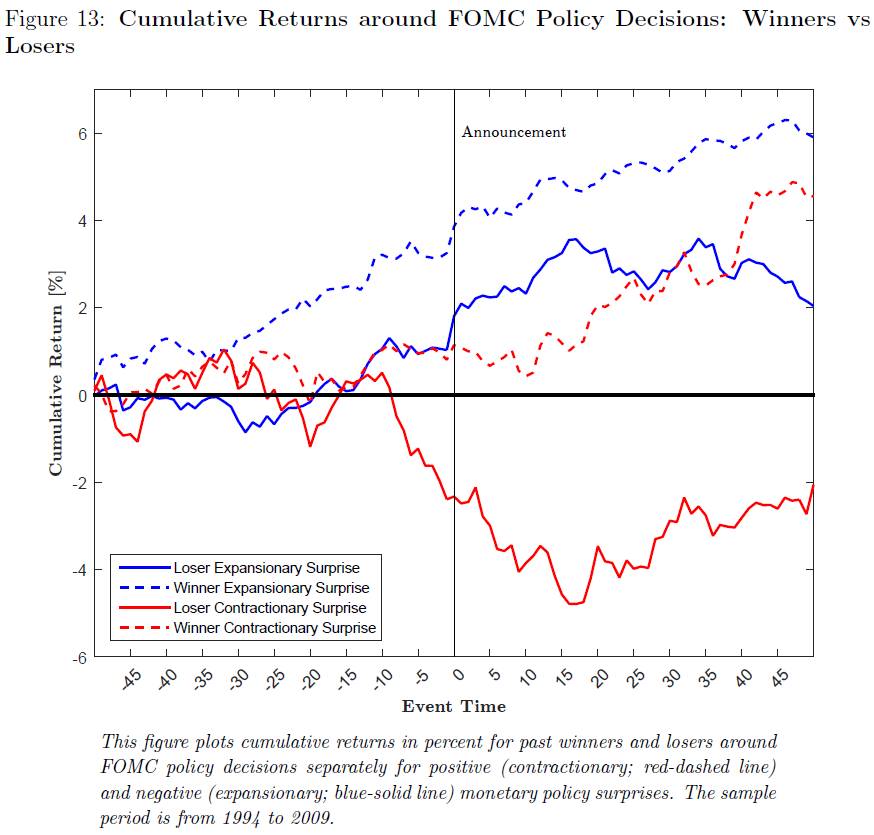
Figure 13, shown below, investigates the large upward drift in contractionary periods by examining both the long and the short leg of the MOM portfolio. As seen below, the upward drift is caused by larger losses on the short book relative to the long book during contractionary decisions.
The results are hypothetical results and are NOT an indicator of future results and do NOT represent returns that any investor actually attained. Indexes are unmanaged, do not reflect management or trading fees, and one cannot invest directly in an index. Additional information regarding the construction of these results is available upon request.
The paper digs into returns to industry portfolios around FOMC decisions, and sees the same general difference in returns as in the market (i.e. industry returns go up around expansionary decisions–one exception is mining returns increasing around contractionary decisions). See Figures 15-18 in the paper for the analysis on industries.
Last, the paper examines returns to international stock markets around FOMC decisions. Figures 19 – 25 find the same general result, except in the Nikkei 225 Index.(2)
Summary
Factor timing is generally difficult and one should be skeptical of results that suggest it is possible. Nonetheless, this is an interesting angle to explore that is typically not discussed in academic research. Overall, this paper highlights that the market reacts differently to expansionary and contractionary decisions by the FOMC. It also highlights the most factor investing portfolios have muted returns in contractionary periods, with the exception being the momentum factor, which has a negative response, driven mainly by the short leg of the long/short momentum portfolio.
For more research on momentum investing, click here.
Monetary Momentum
- Neuhierl and Weber
- A version of the paper can be found here.
- Want a summary of academic papers with alpha? Check out our Academic Research Recap Category.
Abstract:
We document a large return drift around monetary policy announcements by the Federal Open Market Committee. Stock returns start drifting up 25 days before expansionary monetary policy surprises, whereas they decrease before contractionary surprises. The cumulative return difference across expansionary and contractionary policy decisions amounts to 2.5% until the day of the policy move and continues to increase to more than 4.5% 15 days after the meeting. The return drift is a market-wide phenomenon, holds for all industries, and many international equity markets. In the cross section of stocks, size, value, profitability, and investment do not exhibit differential return drifts. Momentum is an exception, because past losers plummet around contractionary monetary policy surprises. A simple trading strategy exploiting the drift around FOMC meetings increases Sharpe ratios relative to a buy-and-hold investment by a factor of 4.


About the Author: Jack Vogel, PhD
—
Important Disclosures
For informational and educational purposes only and should not be construed as specific investment, accounting, legal, or tax advice. Certain information is deemed to be reliable, but its accuracy and completeness cannot be guaranteed. Third party information may become outdated or otherwise superseded without notice. Neither the Securities and Exchange Commission (SEC) nor any other federal or state agency has approved, determined the accuracy, or confirmed the adequacy of this article.
The views and opinions expressed herein are those of the author and do not necessarily reflect the views of Alpha Architect, its affiliates or its employees. Our full disclosures are available here. Definitions of common statistics used in our analysis are available here (towards the bottom).
Join thousands of other readers and subscribe to our blog.