Accruals are a part of any company’s financial reporting. For those unfamiliar with accrual accounting, a simple explanation is that accruals are adjustments made for (1) revenue that has been earned but not received and (2) costs that have been incurred but have not been paid. In short, one should assume that all publicly traded companies have accruals.(1)
Given that accruals are common-place, why should one care about accruals?
Well, let’s say that company A has higher accruals than company B. Natural question: Does having higher accruals matter for future expected returns?
In short, the answer is Yes!
This was originally studied by Richard Sloan in 1996, under the paper titled “Do Stock Prices Fully Reflect
Information in Accruals and Cash Flows about Future Earnings?”. A link to the paper can be found here.
The image below shows the returns to a long/short portfolio that (1) goes long the lowest decile of firms on accruals and (2) shorts the highest decile of firms on accruals.
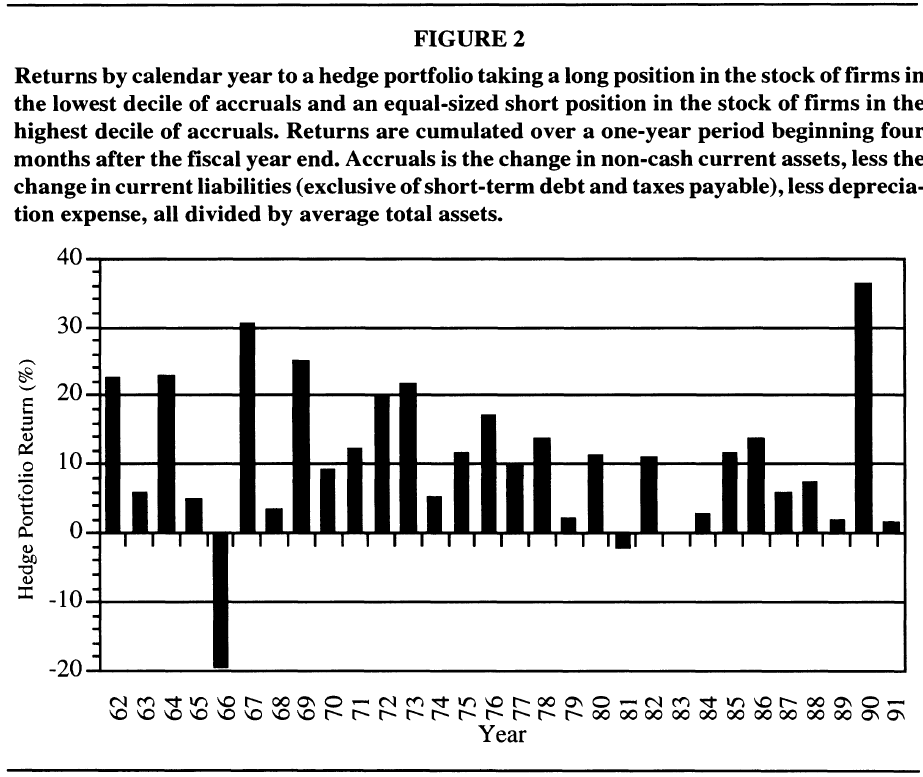
The results are hypothetical results and are NOT an indicator of future results and do NOT represent returns that any investor actually attained. Indexes are unmanaged, do not reflect management or trading fees, and one cannot invest directly in an index.
As can be seen above, in the past, accruals mattered! Firms with higher accruals underperformed firms with lower accruals.(2)
Since this finding, there have been numerous academic papers trying to better understand the “accrual” anomaly. We have written about accruals here, here and here in the past.
Today, we would like to examine a new working paper, titled “Accruals Momentum” by Xiaoting Hao, Juwon Jang, and Eunjun Lee. Their addition to the literature, as we will discuss below, is to examine what happens when firms have consecutive years with either high or low accruals, which they call accruals momentum.
What they find is that firms that consistently have high discretionary accruals experience lower future returns.
Below we dig into the paper.
Set-up and Results for Accruals Momentum
The paper begins by discussing the main measure that they want to examine–discretionary accruals. It has been shown in the past that discretionary accruals have more information than total accruals since total accruals can be influenced by firm-specific information such as sales and firm size (i.e. one should expect a bigger firm, ex-ante, to have higher total accruals). So as opposed to examining the total accruals, the main tests examine “discretionary” accruals. These are the accruals that one would expect a CEO to have more control over.
To determine the value of discretionary accruals, the authors use two methods found in the literature to tease out the discretionary part of accruals. The first method, called “discretionary accruals” in the paper, uses the Jones (1991) method. This regresses Total Accruals (TAQ) against (1) the inverse of last year’s Total Accruals, (2) the Change in Sales, and (3) Property, Plant, and Equipment (PPE).
The exact equation is given below:

The authors similarly compute the modified Jones method (DeChow, Sloan, and Sweeney, 1995) which they call “modified discretionary” accruals throughout the paper.(3)
In both methods, a regression is used(4) while also controlling for two-digit SIC codes and firm years. Using the coefficients, fitted and residual values are given for accruals. The fitted values are deemed to be non-discretionary, whereas the residual values are deemed to be the “discretionary” accruals. The discretionary measure is what the authors examine in the paper.
The authors then split firms into quartiles (4 groups) every year by each of the two discretionary accrual measures. A firm is then deemed to be in the high (low) “accruals momentum” group if they are in the high (low) quartile for four years in a row. Thus, a firm would need to continuously (over a 4-year stretch) be in the top or bottom quartile on discretionary accruals to be in the high or low accruals momentum group.
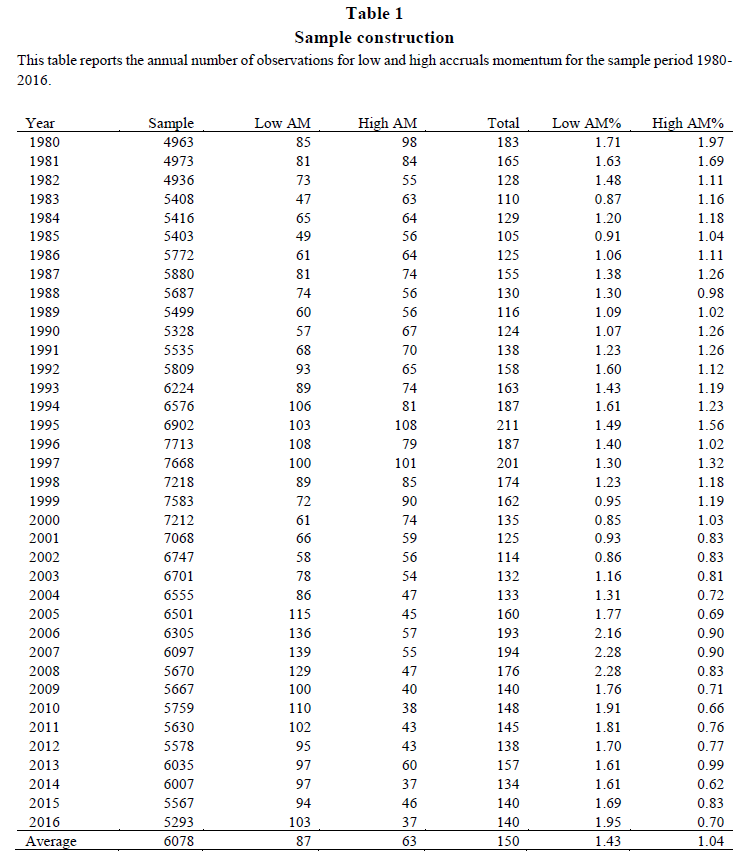
Since there is a 4-year requirement of being in the same high (low) group, this measure does not necessarily split the universe into 4 equal groups. To see this, Table 1 of the paper documents the total number of firms, as well as the number of high and low accrual momentum firms each year. This is shown below.
The results are hypothetical results and are NOT an indicator of future results and do NOT represent returns that any investor actually attained. Indexes are unmanaged, do not reflect management or trading fees, and one cannot invest directly in an index.
As can be seen in the Table, only 1.43% (1.04%) of the firms examined would be classified as low (high) accrual momentum firms. Thus, the long/short portfolios which we will examine below only have a small number of firms.(5)
But what about the high and low accrual momentum firms? What do these firms look like?
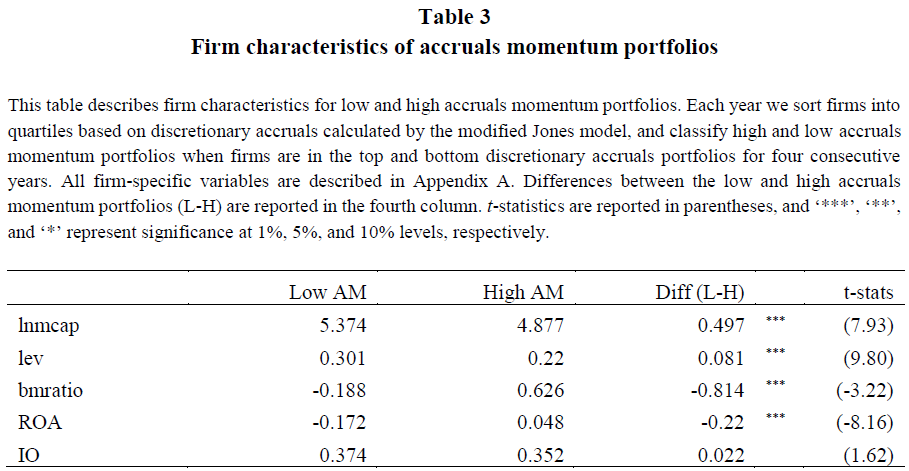
Table 3 of the paper highlights the firm characteristics for the high and low accrual momentum firms. This is shown below.
The results are hypothetical results and are NOT an indicator of future results and do NOT represent returns that any investor actually attained. Indexes are unmanaged, do not reflect management or trading fees, and one cannot invest directly in an index.
As can be seen above, firms with high accrual momentum are smaller and have lower leverage ratios.
But getting back to the original question, does accruals momentum matter?
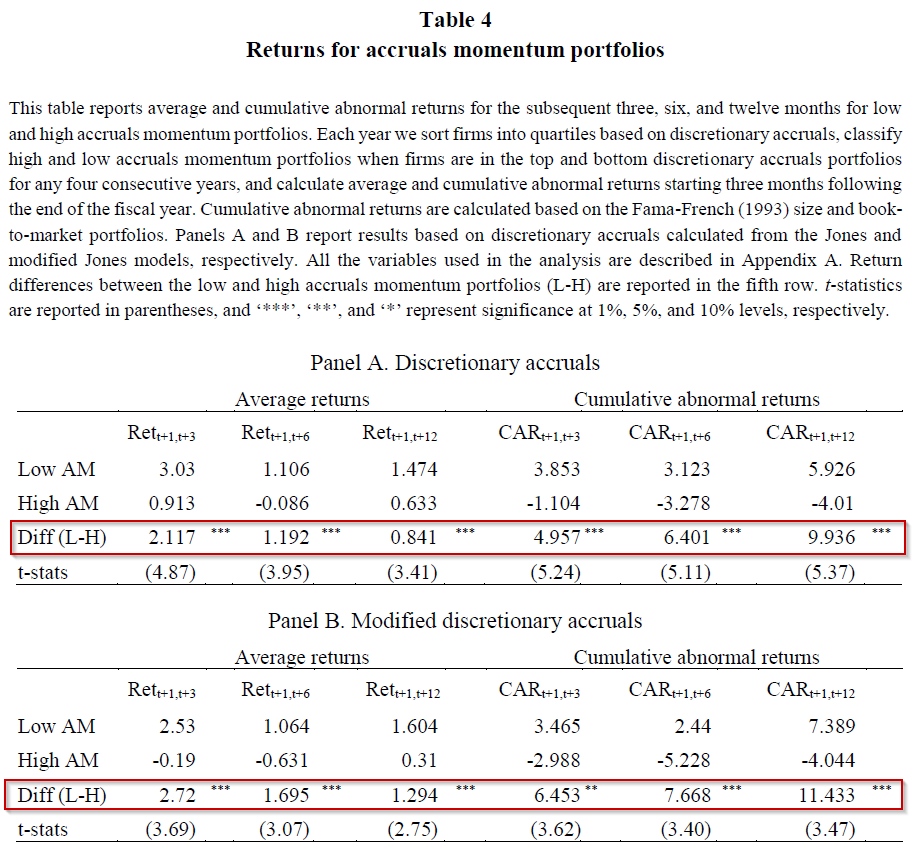
The authors examine the returns to the high and low accrual momentum firms in Table 4. Here, they show either the average returns or cumulative abnormal returns over the next 3, 6, or 12 months, using both discretionary measures.
The results of Table 4 are shown below.
The results are hypothetical results and are NOT an indicator of future results and do NOT represent returns that any investor actually attained. Indexes are unmanaged, do not reflect management or trading fees, and one cannot invest directly in an index.
As is shown above, there is a significantly significant spread between the high and low accrual momentum firms. Firms with high accrual momentum have lower future returns (average or abnormal), while firms with low accrual momentum have higher future returns.
Next, the authors examine the relationship between accruals momentum and earnings surprises. They document their findings in Table 5, shown below.
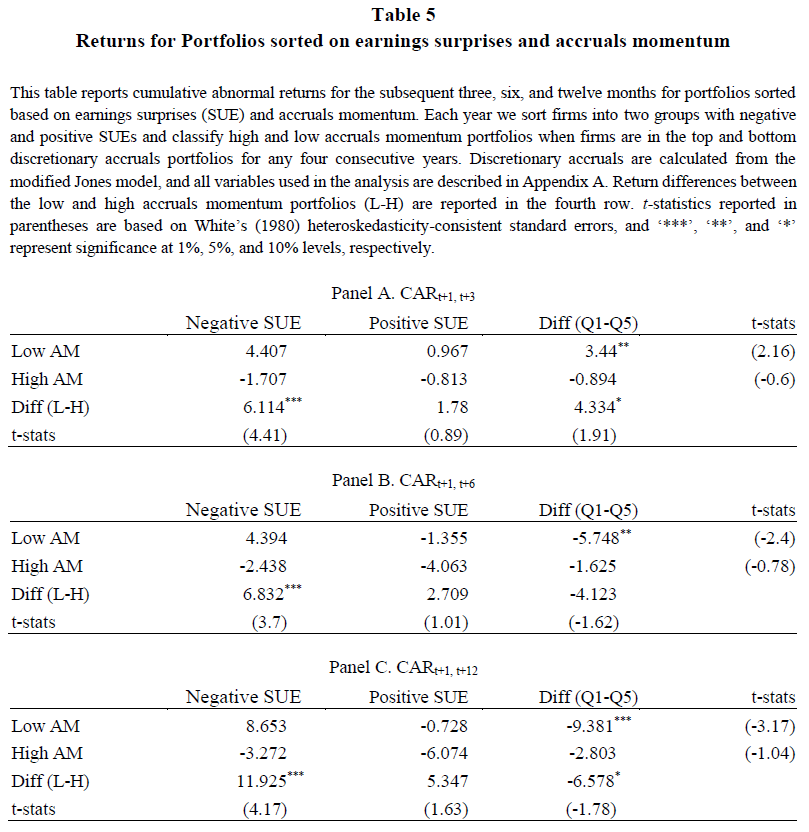
The results are hypothetical results and are NOT an indicator of future results and do NOT represent returns that any investor actually attained. Indexes are unmanaged, do not reflect management or trading fees, and one cannot invest directly in an index.
As found above, the authors find that there is a significant difference between the high and low accrual momentum groups for negative earnings surprises, but not for positive earnings surprises. This is shown by the statistically significant 6.114%, 6.832%, or 11.925% difference over the next 3, 6, or 12 months in the “Negative SUE” column. Thus, it appears investors pay more attention to accruals for negative earnings surprises.
Last, the authors run cross-sectional regressions where they regress returns on a variety of measures, including low and high accrual momentum indicator variables (accmom_l and accmom_h, respectively). They include numerous control variables, including the modified discretionary accruals measure (MDA).
The results are shown below in Table 7.
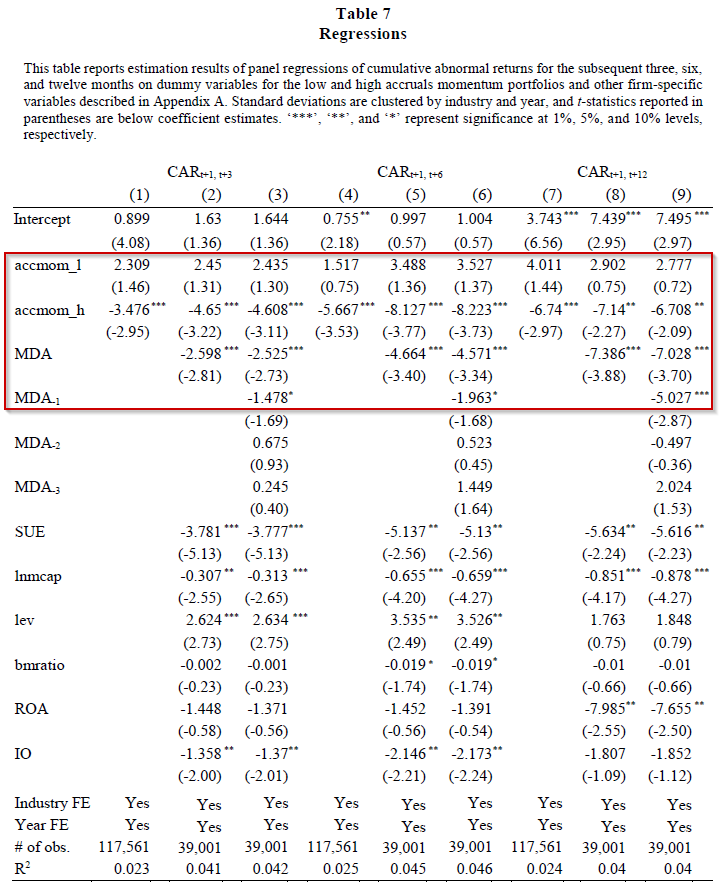
The results are hypothetical results and are NOT an indicator of future results and do NOT represent returns that any investor actually attained. Indexes are unmanaged, do not reflect management or trading fees, and one cannot invest directly in an index.
As is shown above, there is a significant negative loading on the high accrual momentum indicator variable (accmom_h), a significant negative loading on the modified discretionary accrual variable (MDA), and an insignificant (but positive) loading on the low accrual momentum indicator variable (accmom_l). Thus, it appears investors but more weight on high accrual momentum firms relative to low accrual momentum firms—thus, these would be firms one would want to short or simply avoid.
Conclusion:
Overall, this paper highlights that firms with high (low) accrual momentum, defined as those firms that have consistently had high (low) accruals for a four-year period, have lower (higher) future expected returns. The paper results need to be caveated that (1) they include small/micro caps and (2) the long/short portfolios only include ~2.5% of the firm-year observations. However, the results add to the literature by finding that firms with consistent high accruals could be shorted or avoided. These results are in line with the logic we use in our Quantitative Value process, whereby we try to avoid high accrual firms.
Let us know what you think …
Accruals Momentum
- Xiaoting Hao, Juwon Jang, Eunju Lee
- A version of the paper can be found here.
- Want a summary of academic papers with alpha? Check out our Academic Research Recap Category.
Abstract:
In this study, we examine the information content of accruals momentum defined as a string of high or low discretionary accruals for four consecutive years. We find that firms that consistently report high levels of discretionary accruals experience low subsequent returns. The results are robust after we control for annual levels of discretionary accruals for the estimation period of accruals momentum. A long-short portfolio based on accruals momentum generates significantly positive returns for the subsequent periods. Our results also show that the accruals momentum impact is more pronounced for low growth firms, suggesting that the overpricing of stocks with high accruals momentum is driven by managerial discretion to manage earnings. This refutes the possibility that our results are driven by the growth anomaly.

References[+]
| ↑1 | I assume this is true, but could be wrong! |
|---|---|
| ↑2 | The strategy did diminish after publication, arguably because Sloan took the concept to industry. |
| ↑3 | Please read the paper to see the details of this measure |
| ↑4 | Such as the equation above. |
| ↑5 | An important caveat must be given to the results examined below and throughout the paper. As is shown in Table 1, there are around 6,000 observations per year, as the authors include all firms with a stock price above $5 (and below $999). Thus, considering that most investors only invest in the top 1,000 stocks (or top 3,000), there is a decent amount of stocks that one may consider being micro-caps in the sample. Whether or not these small caps make it into the sample is tough to decipher from the paper. |
About the Author: Jack Vogel, PhD
—
Important Disclosures
For informational and educational purposes only and should not be construed as specific investment, accounting, legal, or tax advice. Certain information is deemed to be reliable, but its accuracy and completeness cannot be guaranteed. Third party information may become outdated or otherwise superseded without notice. Neither the Securities and Exchange Commission (SEC) nor any other federal or state agency has approved, determined the accuracy, or confirmed the adequacy of this article.
The views and opinions expressed herein are those of the author and do not necessarily reflect the views of Alpha Architect, its affiliates or its employees. Our full disclosures are available here. Definitions of common statistics used in our analysis are available here (towards the bottom).
Join thousands of other readers and subscribe to our blog.