Trend following is well-known and the simplest version is as follows: you buy an asset when it has positive momentum (the price goes up) and you sell it and go to cash (or any other safe haven) when the momentum turns negative.(1) The best-known example of trend following is on the monthly ETF SPY (based on the SP500 index) and the 10-month SMA momentum (SMA10).
In this article, we will introduce a wrinkle on the simple 10-month SPY MA trend-following strategy. A strategy I call trend following “on steroids”. The strategy will switch between the risky asset (i.e., SPY) and “cash”(2), but instead of using the momentum of SPY we will use the breath of a separate “canary universe” (3) to signal the switch.
We search for the assets of the canary universe in-sample and test it out-of-sample over nearly 50 years. In addition, we will use a fast momentum filter and a special rotating bond universe for “cash” (or out-of-the-market universe) to arrive at our trend following “on steroids” concept.
As a result, this experimental trend following strategy is shown to deliver annual returns (R) of over 15%, while the max monthly drawdown (D) is less than 15% over the whole period. To show that our canary universe (together with the special bond universe and fast momentum) not only works for SPY, we also give the results of a twelve-asset risky universe. Of course, more research needs to be done and past performance may fail in the future, but we do think the concept of looking at a “canary universe” has the potential to improve trend-following strategies.
Winning More by Losing Less
Inspired by Alpha Architect (see even-god-would-get-fired-as-an-active-investor”), we will assume that we are able to predict if SPY next month will be down (return<0%). Using this “perfect-foresight” signal, we will switch between stocks (SPY: S&P 500 Total Return Index) and bonds (IEF: Intermediate-Term Treasury Bond Index) as “cash.” Prices are total returns (TR) and include distributions and dividends.
How would the strategy work from Dec 1970 with this perfect foresight?
Well, hold your breath: the return (CAGR) equals an incredible R=32,6% with a maximum (monthly) drawdown D= 6,5%, where R stands for the compounded annual growth rate (CAGR) and D equals the maximum (monthly) drawdown (MDD).
Not bad.
This simple example shows that good timing has the potential to add a lot of value. The problem is that timing is difficult for people that don’t have perfect foresight (i.e., all of us!). Simple trend following, while interesting, is not a perfect predictor of next month’s SPY returns.
But can we improve the signal by looking at other assets? This is where our “canary in the coal mine” concept comes in. Perhaps trends in other assets foreshadow the trend of SPY?
The Canary Universe
Assume there exists a “canary” universe of assets which are better predictors of next-month SPY than the trend of SPY itself. We define the “breadth” of the canary universe as the number of assets of this canary universe with positive trends. Alternatively, we will denote “b” as the number of “bad” assets in the canary universe with “bad” (non-positive) trends.
Let’s use a very simple signal for SPY: go to “cash” when some assets in the canary asset goes bad (ie. has a non-positive trend), so when b>=B with B the so-called breadth parameter. We will call this strategy “breadth momentum.”(4) In this article we limit ourselves to B=1, so we go to “cash” when one or more of the canary assets are bad and stay in risky SPY when none of the canary assets have poor trend signals.
So far so good. But how do we identify the right canary assets? Well, we refer to our prior work(5) for details, but in short, we searched for the best canary universe over the in-sample period from Dec 1926 – Dec 1970. We found a two-asset universe consisting of the US Aggregate Bond and Emerging Markets as the optimal canary universe to identify the trend of SPY in the next month. In the following, we will use two Vanguard ETFs — BND and VWO — to represent both assets.
What is the intuition for using BND and VWO as a canary universe? One hypothesis is that SPY is sensitive to yields (higher yields leading to lower SPY(6)), and a similar mechanism may hold for US currency (higher USD leading to lower SPY(7)). And higher yields/USD are reflected in lower BND/VWO prices, resp. In addition, VWO may also signal emerging market unrest. Regardless, what matters is the out of sample results of the strategy.
Fast Momentum
We do not use the traditional SMA10 filter in our analysis, but something slightly faster, ie. the weighted variant of the well-known average return over the last 1, 3, 6 and 12 months, which we will call the 13612W filter.
Since this momentum filter gives a heavy weight on the last (most recent) month, it goes to cash more aggressively than the SMA10 (and for that matter, the unweighted 13612 and the lagged 12 month return) momentum, used elsewhere. That’s why we call 13612W a “fast” momentum filter. However, it also goes faster back into the market, for the same reason. Combined, our 13612W filter was 46% in cash based on the b>=1 canary signal of BND/VWO, while SMA10 using the same mechanism was also 46% in cash(8).
We used the “fast” 13612W momentum filter also in our previous paper (VAA), where we first examined breadth momentum as a signal for trend following. However, in the case of the VAA strategy, the canary universe was equal to the risky universe (in contrast to the separate canary universe like BND/VWO in our recent DAA paper). The slightly slower 13612 filter is used in our older CAA and EAA strategies(9).
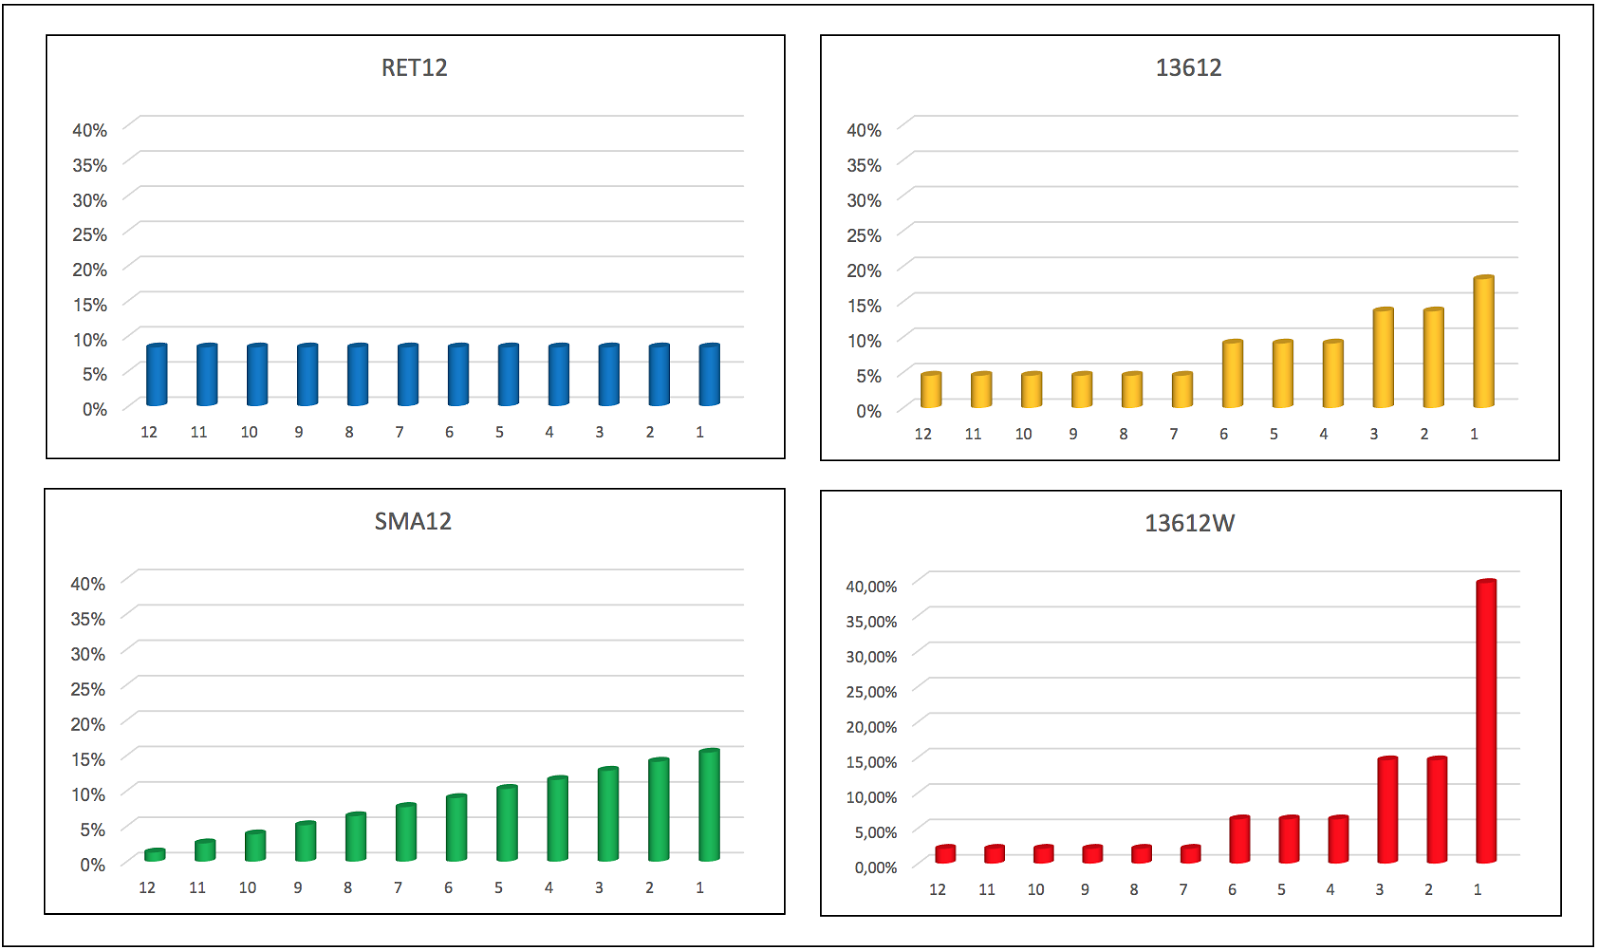
In Fig. 1 we show the response patterns (monthly return weights for various lags) for different momentum filters. Notice that in all these filters we include the last month return, sometimes with a heavy weight (as in 13612W). We don’t assume reversal in the last month for our assets, as is often done in momentum studies for individual stocks.(10) In fact, we think it is the combination of the canary signal based on our fast (first month) momentum filter which gives a boost to our SPY trend following strategy.
Fig. 1 Response patterns (monthly returns weights) for various momentum filters.
The “Cash” Universe
To arrive at our SPY trend following “on steroids” strategy there are 2 core changes from a simple 10-month MA strategy:
- We use a fast momentum filter 13612W.
- We use breadth momentum based on the canary universe of VWO and BND.
But there is a third step that really ramps the strategy: we expand the “cash” from a single asset (IEF) to multiple assets. We will use a cash (or bond) universe consisting of SHV (1m-1y T-Bill), IEF (7-10y Treasury) and UST (2x leveraged IEF) and pick each month the best performing bond out of these three, using again our fast 13612W momentum.
The Results
First, before presenting our SPY trend following “on steroids” results, let’s look at the simple and traditional SMA10 as momentum filter on SPY itself and IEF as cash, over our full out-of-sample period Dec 1970 – Oct 2018.(11) The results are R/D= 12.3/23.3% (using one-sided transaction costs of 0.1%). SPY itself (without any timing) shows R/D= 10.4/50.8% over that period, so trend following with SMA10 is effective both in terms of return R (1.9% better) and drawdown D (reduced by more than half).(12)
Using the canary universe BND/VWO, fast 13612W momentum, and our “steroid” bond universe (SHV, IEF, UST), the results of our special trend following strategy on SPY are R/D=16.5/14.4% over the full out-of-sample period of nearly 50 years (Dec. 1970 – Oct 2018). See also the (log) equity line of DAA in Fig. 2 and the drawdowns in Fig. 3. All these results also includes 0.1% transaction costs.
Fig. 2 Log equity DAA vs. SPY (and relative DAA/SPY), Dec 1970 – Oct 2018, R = 16.5%
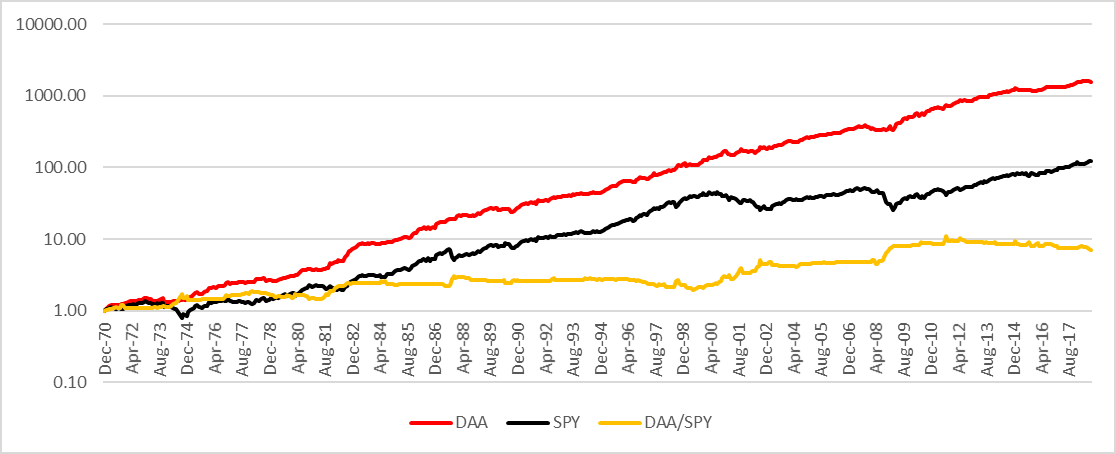
The results are hypothetical results and are NOT an indicator of future results and do NOT represent returns that any investor actually attained.
Fig. 3 Drawdowns of DAA vs. SPY, Dec 1970 – Oct 2018, D = 14.4%

The results are hypothetical results and are NOT an indicator of future results and do NOT represent returns that any investor actually attained.
We arrive at similar results for more recent periods, ie. R/D=15.3/14.4% over the last 30 years (Oct 1988 – Oct 2018) and R/D= 15.7/14.4% over the last 10+ years (Apr 2008 – Oct 2018, including the Financial Crisis). For the last year (Oct 2017 – Oct 2018) the results are R/D= 6.9/2.8%, where in the bond rotation the role of the out-of-market bond UST is taken over by TBill-like SHV in view of rising yields. SPY did R/D= 6.6/6.9% over the last year.
To show that our canary universe (together with the special bond universe and fast momentum) not only works for SPY, we also show the results of a twelve-asset risky universe (SPY, QQQ, IWM, VNQ, GSG, GLD, IEF, LQD, TLT), where we used the equal weight Top3 selection (ie. rotation, again based on our fast filter) for the monthly in-the-market portfolio. The results are R/D= 20.4/11.9% for the full period (Dec1970 – Oct 2018), R/D= 16.6/11.9% for 30 years (Oct 1988 – Oct 2018), and R/D=12.2/11.9% for 10+ years (Apr 2008 – Oct 2018).(13)
Conclusions
We have shown that by using the concept of breadth momentum on a separate canary universe of two assets (BND/VWO), a fast momentum filter, and a rotating bond universe with leverage, we were able to deliver trend following “on steroids” for SPY with annual returns over 15% and max drawdowns below 15% over nearly 50 years.
However — and this is a big “however” — the analysis was conducted over a long period of mainly decreasing interest rates! In the future, we may see a long-term regime of rising interest rates, which implies that we may not see the kind of performance that was witnessed in the past.(14)
Caveats aside, we hope that the concept of “breadth momentum” will inspire new ideas and research.
Good luck!

References[+]
| ↑1 | AA has an archive of research on the subject here. |
|---|---|
| ↑2 | “Cash” refers here to any out-of-the-market asset (save heavens), like government bonds, see also the section on the Cash Universe. |
| ↑3 | We call this the canary universe since its role is similar to the canary in the coal mines. |
| ↑4 | See our previous VAA paper and our recent DAA paper, where we introduced this concept. |
| ↑5 | See our previous VAA paper and our recent DAA paper, where we introduced this concept. |
| ↑6 | See eg. https://papers.ssrn.com/sol3/papers.cfm?abstract_id=3259447 |
| ↑7 | See eg. https://app.hedgeye.com/insights/68178- the-investing-implications-of-a-strong-u-s-dollar |
| ↑8 | In our DAA paper, we also investigate B=2 with the BND/VWO canary universe, which leads to a much lower cash rate of 28%. |
| ↑9 | See https://ssrn.com/abstract=2606884 (CAA) and https://ssrn.com/abstract=2543979 (EAA). |
| ↑10 | See the seminal 1993 paper of Jegadeesh and Titman on momentum (Journal of Finance XLVIII, 65/91). |
| ↑11 | More about our ETF-proxy data and the way it is constructed can be found in our PAA paper, see https://ssrn.com/abstract=2759734 |
| ↑12 | Similar to results found by AA. See here and here. |
| ↑13 | More examples of the use of breadth momentum and the canary universe can be found in our DAA paper and in a forthcoming blog at trendxplorer.com |
| ↑14 | levered bonds don’t fair so well in a rising interest rate environment. |
About the Author: Wouter Keller
—
Important Disclosures
For informational and educational purposes only and should not be construed as specific investment, accounting, legal, or tax advice. Certain information is deemed to be reliable, but its accuracy and completeness cannot be guaranteed. Third party information may become outdated or otherwise superseded without notice. Neither the Securities and Exchange Commission (SEC) nor any other federal or state agency has approved, determined the accuracy, or confirmed the adequacy of this article.
The views and opinions expressed herein are those of the author and do not necessarily reflect the views of Alpha Architect, its affiliates or its employees. Our full disclosures are available here. Definitions of common statistics used in our analysis are available here (towards the bottom).
Join thousands of other readers and subscribe to our blog.